Summary
TradingView is a very popular tool amongst retail traders and investors. They are relatively new this space compared to older established tools like TC2000 and Stockcharts.com. TradingView is a web-based charting software with powerful tools and features that an affordable alternative to the various desktop-based charting software. This charting software includes very useful features and tools. One feature that stands out most to us is that you can find securities from any market to analyze ranging from stocks, futures, forex, bonds and cryptocurrencies. Other platforms such as TC2000 don’t have the ability to look at cryptocurrencies.
TradingView Pros
- Socially oriented with chat rooms, livestreaming, sharing trade ideas and sharing code scripts
- A huge range of indicators from stock to custom made all available on the platform
- Easy to integrate with your broker to trade right on the chart
- Easy to use mobile app on Apple and Android
- Free version works great and is enough for swing traders or investors
- Paid plans remove ads and gives you access to more features to make sure you don’t miss any trade opportunities
TradingView Cons
- Not suited for fast day trading
- The most expensive plan is priced quite high
- Customer support is only web based via chat
- Any one update can change the look and feel of the TradingView charting tool after you’ve grown accustomed to it
- The best features and tools are only available if you are a paying customer
What are TradingView’s Features?
- The nice looking charts that started it all
- Worldwide market data coverage on various underlyings
- Highly versatile screeners for equities, cryptos, and traditional currencies
- 50+ smart drawing tools
- 100k+ technical indicators
- 12 customizable chart types
- Backtesting for trading strategies
- Create Various Watchlists
- Headline news
- Market data window
- Social networking
- Integrated trading capability with select brokers
- Advanced charting
Brief Overview of TradingView
TradingView is a social network of 15 million+ traders and investors using the world’s charts and analysis tools to spot opportunity in global markets. They best used to follow your favorite assets, find trading ideas, chat with others, spot trends, and place trades directly on their charts.
Top Brokers on TradingView
TradingView have a list of featured brokers that can integrate with so you can trade on the chart itself.
Firms include:
- Tradovate (futures)
- Ironbeam (futures)
- OANDA (currencies)
- TradeStation (options, stocks, futures, and cryptocurrencies)
- AMP Global (futures)
- Alpaca (stocks)
- FOREX.com (currencies)
- Gemini.com (crypto)
TradingView also is compatible with API software.
How to Set Up with a Broker and Place Trades
- Create a TradingView account and login with your credentials
- Create an account with a compatible broker listed above
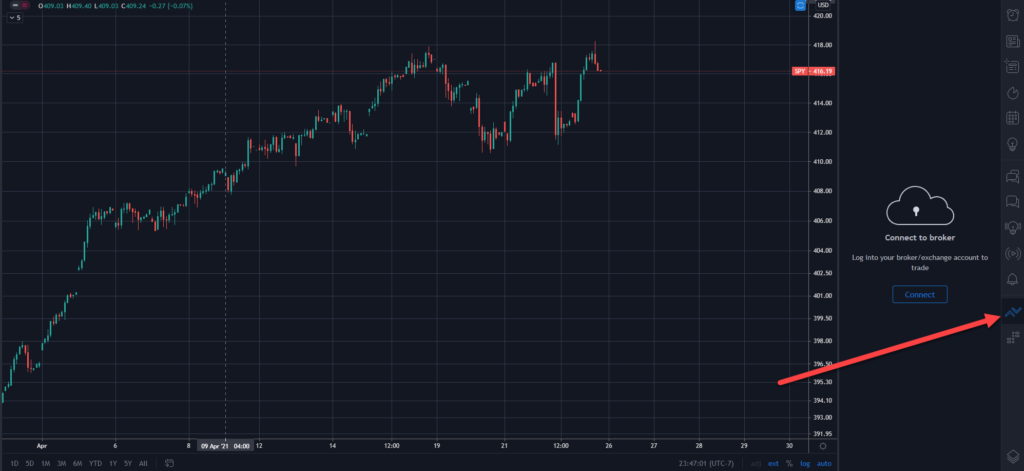
- Navigate to www.tradingview.com/chart and open the Trading Panel and click the “Connect” button
- You can place an order in a few ways: through the Trading Panel, the Chart Context menu, the Chart “+” Sign menu, or through the Buy/Sell.


Pricing Schedule
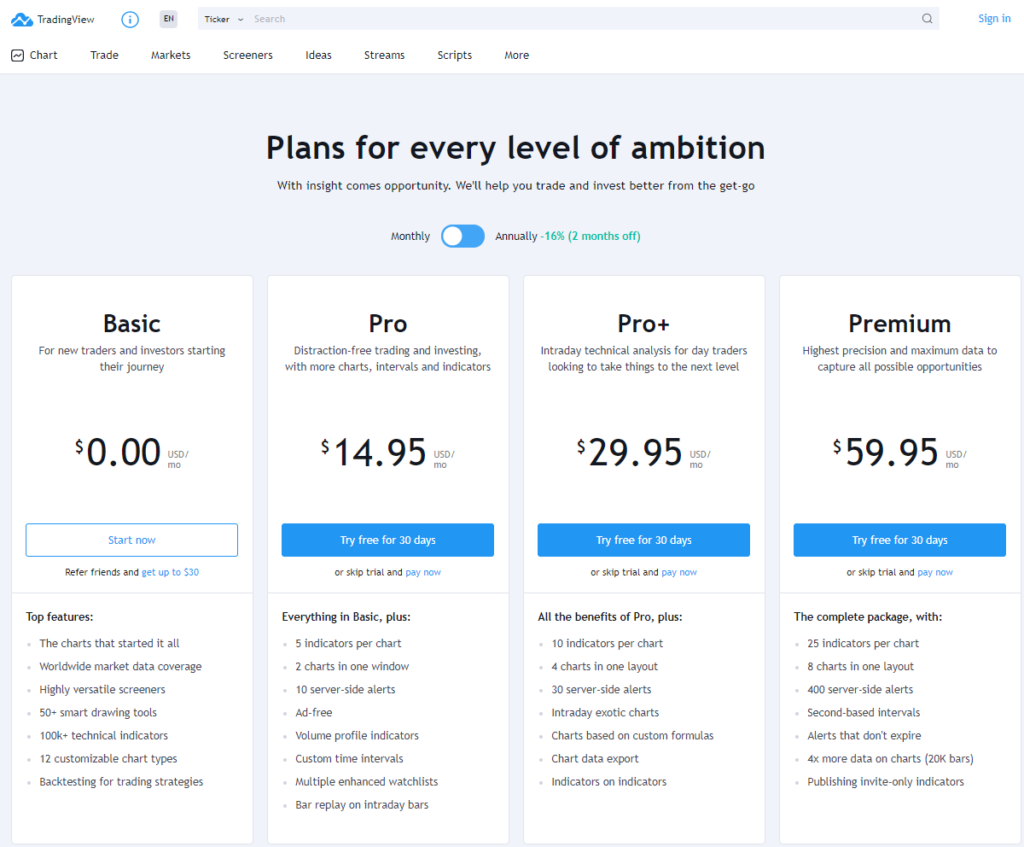
When it comes to TradingView’s pricing, what do you get at each price tier? For the first free level you get the following:
Basic Plan
- The charts that started it all
- Worldwide market data coverage
- Highly versatile screeners for stocks, forex, and crypto
- 50+ smart drawing tools for your trading charts
- 100k+ technical indicators
- 12 customizable chart types
- Backtesting for trading strategies
Pro Plan – Distraction-free trading and investing, with more charts, intervals and indicators
Everything in Basic, and you get the following below:
- 5 indicators per chart
- 2 charts in one window
- 10 server-side alerts
- Ad-free, no more ads period
- Volume profile indicators
- Custom time intervals, for example 41 min chart
- Multiple enhanced watchlists
- Bar replay on intraday bars
Pro+ Plan– Intraday technical analysis for day traders looking to take things to the next level
Includes all the benefits of Pro, and the features below:
- 10 indicators per chart
- 4 charts in one layout
- 30 server-side alerts
- Intraday exotic charts
- Charts based on custom formulas
- Chart data export
- Indicators on indicators
Premium Plan – Highest precision and maximum data to capture all possible opportunities
The complete package, with:
- 25 indicators per chart
- 8 charts in one layout
- 400 server-side alerts
- Second-based intervals
- Alerts that don’t expire
- 4x more data on charts (20K bars)
- Publishing invite-only indicators
Pro Tip: The best time to buy for maximum savings is during Black Friday and Cyber Monday where discounts can go up to 60% off. Then once you’re on a plan you like, you can always renew it during the same period the year after that.

Customer Support
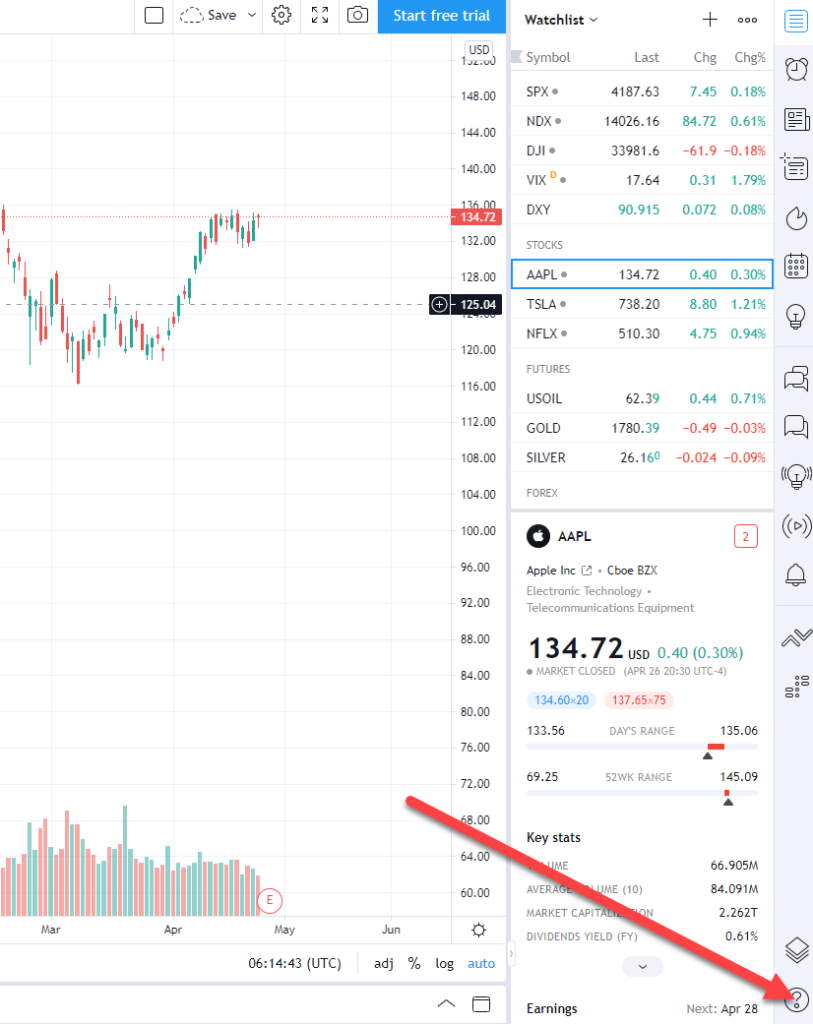
For TradingView’s customer support, you will need to click on the “?” icon to launch the help center. You can also go straight to tradingview.com/support/.
If you can’t find the answer you are looking for then you can submit a help ticket for support. This level of support will require that you have a paying subscription. They will ask you to take a screenshot of it’s necessary and someone will respond to your question within days but sometimes within hours.
Aside from support via tickets, TradingView does not offer phone or online chat support.

Markets Quotes
You can see all the major markets in one view in TradingView by going to https://www.tradingview.com/markets/. From here, you can find price info on indices, futures, currencies, bonds, stocks, and cryptocurrencies.
Best indices to follow are:
- S&P 500
- Dow 30
- DAX
- FTSE 100
- Nikkei 225
- Hang Seng
For economic calendar you can find it at the right hand side of the TradingView’s chart by clicking the calendar icon. You should see something like this:
Researching Trades Ideas
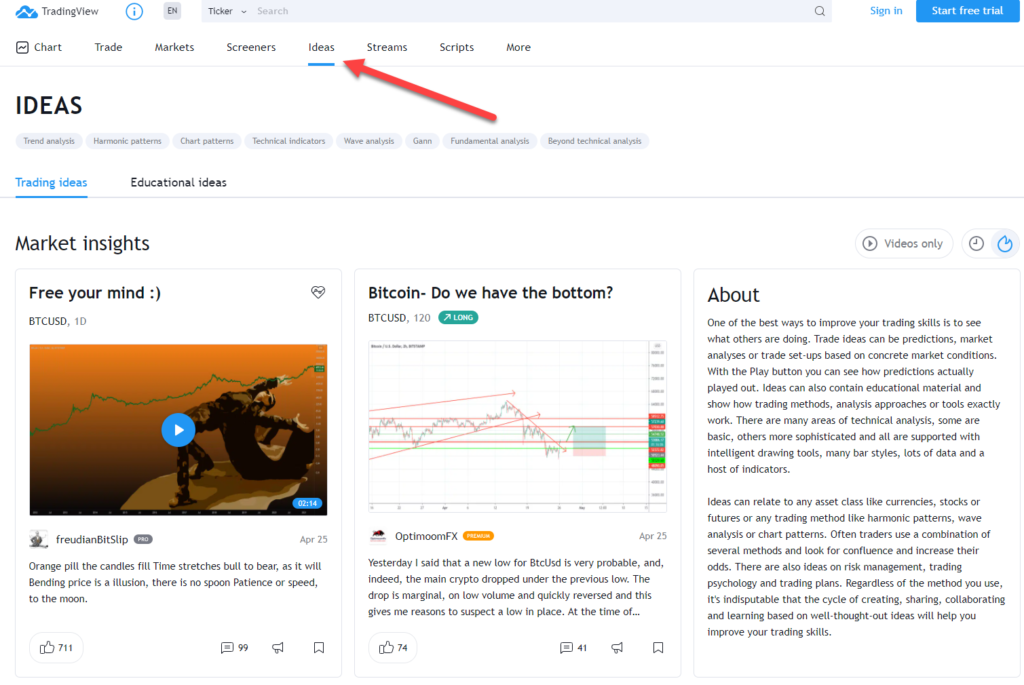
One of the strengths of TradingView is the power of the community. By going to the Ideas tab on the home page as shown here:

You will find other users’ trade ideas via charts and video formats. You can filter the list of ideas with the asset you are interested to trade. Each idea has its own methodology based on the individual’s knowledge and work put into these ideas. Best way to go about it is that once you found an idea you like, you can follow the person who created the trade idea so that next time that person posts a new idea, you will be notified.
Examples of trade idea analysis include:
- Trend analysis
- Harmonic patterns
- Chart patterns
- Technical indicators
- Wave analysis
- Gann analysis
- Fundamental analysis
You can also find trade ideas from a streamer under the Streams tab or go to https://www.tradingview.com/streams/
Aside from ideas and streams, you can also use a screener (stocks, currencies, or cryptocurrencies). https://www.tradingview.com/screener/ or use this one below:
What you can filter in a scan is extensive. Here are some examples of what you can filter for in stocks
- Symbol Type
- Basic EPS
- Change %
- Net Change
- Rating
- Volume
- Market Capitalization
- Exchange
- Price to Earnings Ratio (TTM)
- Debt to Equity Ratio (MRQ)
- Dividends Yield (FY)
- Dividends per Share (MRQ)
- Enterprise Value (MRQ)
- Enterprise Value/EBITDA (TTM)
- Gross Margin (TTM)
- Gross Profit (MRQ)
- Sector
- Number of Employees
- Shares Float
- Monthly Performance
- Candlestick Pattern
- Relative Strength Index (14)
- Simple Moving Average (20)
- and more
For Forex and cryptocurrencies, you will find a very similar scanner.
Pro Tip: if you are scanning for certain conditions ie. RSI at 30 or below, make sure to have the scanner set at a time frame you desire to trade. Otherwise, you can be trading on wrong signals.
TradingView’s Charts
TradingView’s charting software is very intuitive and easy to use. It is highly customizable. If you want to change something on the chart, you will usually find the setting after right-clicking somewhere on the chart. There’s a light and dark theme that you can quickly toggle for personal preference.
Here is what it looks like when you’re in the chart’s settings:

Some features you must try when using TradingView:
- Technical indicators
- Intraday bar replay
- Financial tab for fundamentals
- Alerts
Here is a live chart of the S&P 500 futures below:
Pine Wizards – Social Network Sharing of Trading Scripts
TradingView is built with community in mind. For people who can code and are keen to math, checking out the pine scripts that were developed by the community is definitely worth checking out. You can find it here: https://www.tradingview.com/pine-wizards/
There are also different chat rooms for various topics and assets both can be public or private based on your account privileges.
Mobile App
The TradingView app works just as well as the web browser version and can be found on both android and ios.
Features on the mobile include:
- Individual watchlists and alerts
- Syncing your accounts for mobile and web version
- Real-time data from global exchanges
- Technical indicators
As of now, you can’t trade using the mobile app like you could on the web version. TradingView says that they are working on that. If there are any issues, their support team is quick to respond and help mobile-support@tradingview.com
The Bottom Line
TradingView is top tier for charting and analyzing asset prices. They also have charts for wide range of markets across the entire world. This is one feature that other competitors don’t offer yet. With an active community to constant build scripts and share trade ideas, it’s also great to network and improve your trading and investing. Since you can start for free, there’s no reason not to use it. The Pro plan is not too expensive if you need to upgrade.
Tradethischart’s Rating: 9/10
Check out TradingView now.