Where is Bitcoin Going in 2023 to 2024?
Price prediction is a fool’s game and the probabilty of it being correct is low. However, we can make some educated guesses based on evidence and levels.
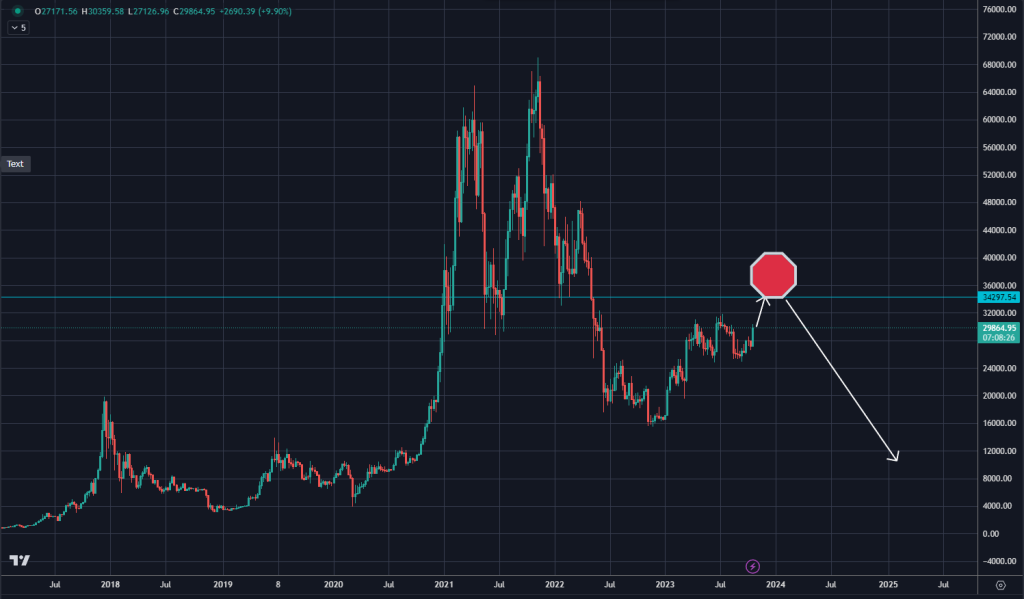
Since November of 2022, bitcoin has rallied from ~16K to ~30K. That is medium term bullish.
However, when you look at the bigger picture here on the weekly chart, you can clearly see that bitcoin is far away from all time highs and the rally has not been strong as it was back in November 2020.
Given the recent momentum and news driven environment, we can expect the rally to continue and hit major resistance at around 34K. After which, the medium term trend may turn and the long term down trend can continue.
Another angle that one must consider is that crypto usually go up and down with the stock market. The stock market has not made new highs as well and we have started to see evidence of downside momentum. If the stock market continues to fall, crypto should follow and we will do some downside price discovery. The news headlines will become doom and gloom. When one sees blood in the streets, it may be a sign to start accumulating.
Bitcoin 10/24/23 Price Update
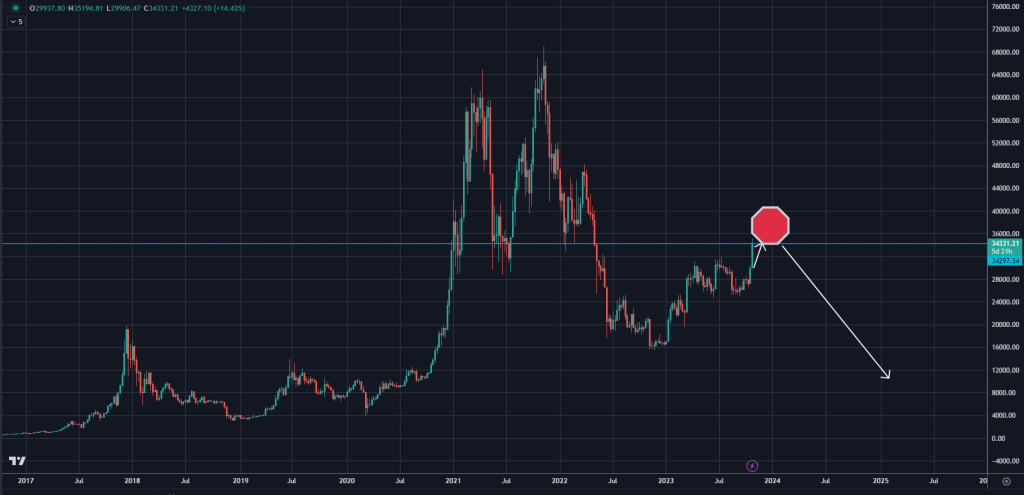
Incredible, after just a few days from the first post, we have price stopping at the resistance line right above at around 34K.
Price can still continue higher of course, there is a lot of strength in this run up and the top here can take weeks to form.
If we reverse here quickly and have sustain sell offs again for weeks at a time, then we can come back and determine that we are indeed in a bear market still. We can then safely call this a bear market rally.