Overview of the Bull Bear Power Indicator
The Bull Bear Power Indicator is a useful tool for traders. It provides insight into the strength of bulls and bears in the market. This helps traders make better decisions about their investments.
Here’s an overview of the indicator:
| Indicator Name | Bull Bear Power Indicator |
| Type | Momentum Indicator |
| Calculation | Difference between 13-day and 26-day exponential moving averages (EMA) |
| Interpretation | Positive values = bullish sentiment. Negative values = bearish sentiment. |
| Usage | Identify buying or selling opportunities based on changes in momentum. |
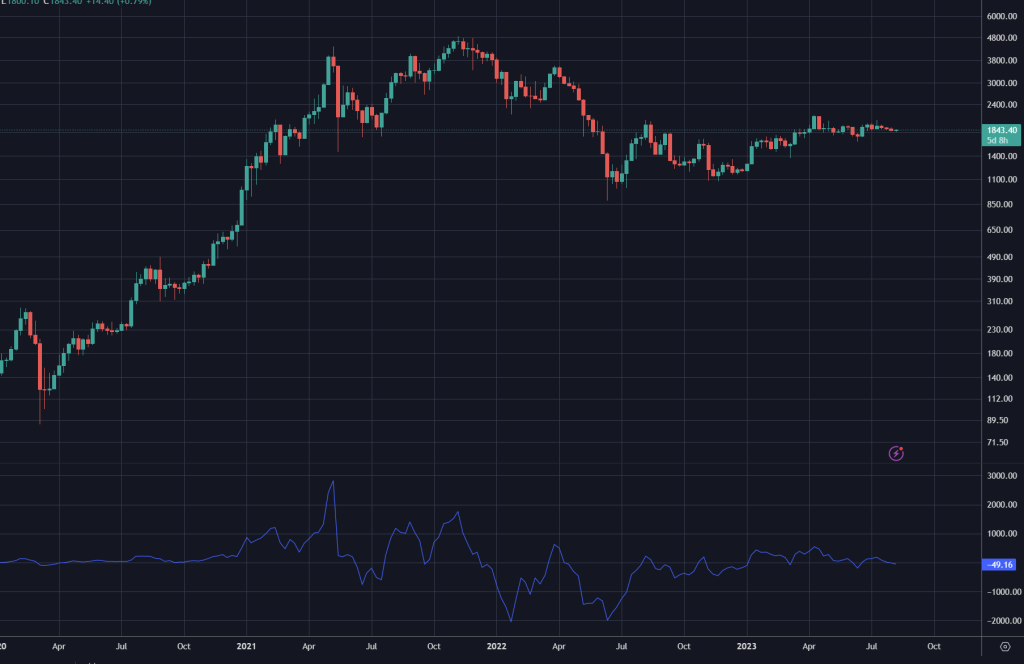
This indicator uses two exponential moving averages to see if bulls or bears are in charge. Positive values mean bulls are stronger, which suggests an upward trend. Negative values indicate the bears are winning, meaning a downward trend. Traders use this info to decide when to buy or sell.
An interesting piece of history surrounding the Bull Bear Power Indicator is that it was first presented by Alexander Elder in the 1980s. He was an author and trader with a revolutionary approach to technical analysis. His work changed the way traders view market strength and the indicator has become a staple for many.
Explanation of the Bull Bear Power Indicator and its purpose
The Bull Bear Power Indicator is a must-have for traders. It uses price and volume data to help investors make decisions.
This indicator reveals the strength of bulls and bears. If it’s positive, buyers have an advantage. If it’s negative, sellers dominate.
It can also spot divergence patterns. When prices are moving but the indicator isn’t, it’s a sign of weakness.
Dr. Alexander Elder created it as a modification of the Moving Average Convergence Divergence. He wanted an easier-to-read indicator that showed supply and demand dynamics.
Step 1: Understanding the Bull Bear Power Indicator
Gain knowledge of the Bull Bear Power Indicator by knowing how it works and its calculation.
Interpret its values as positive means bullish market, negative means bearish.
Analyze the indicator’s trend to identify potential buying or selling.
Also, use the indicator with other technical analysis tools for a full market assessment.
Practice using the indicator on different charts & timeframes for proficiency and improved trading strategies.
Remember, it’s just one tool of many in technical analysis. But, when used effectively, it can give useful insights into market dynamics.
Alexander Elder, an American trader, author, and financial markets analysis expert created the Bull Bear Power Indicator.
Step 2: Interpreting the Bull Bear Power Indicator
The Bull Bear Power Indicator is a great asset for traders. It helps them decide when to enter or exit trades. Here’s how to interpret it:
- Look for divergences. Bullish divergence happens when prices drop, but the indicator rises. And bearish divergence happens when prices rise, but the indicator falls.
- Analyze crossovers. A positive crossover shows bullish sentiment. That means buyers are dominant. A negative crossover shows bearish sentiment. That means selling pressure is high.
- Observe extreme values. High positive values indicate strong buying. Low negative values show intense selling.
- Monitor histogram bars. Tall bars mean more power and momentum in either direction.
- Compare with price action. Look for confirmation between rising prices and bullish readings, or falling prices and bearish readings.
- Combine with other indicators. Use tools like moving averages, volume indicators, and support/resistance levels to validate Bull Bear Power Indicator signals.
Remember, each trading strategy has different interpretations. And the Bull Bear Power Indicator should not be used alone. Combine it with other methods for the best results.
Step 3: Using the Bull Bear Power Indicator for trading decisions
The Bull Bear Power Indicator is an amazing tool to help traders make smart decisions in the stock market. It monitors the strength of bulls and bears, giving traders an insight into market sentiment. Here’s how to use it:
- Identify it: It has two lines – the bull power line and the bear power line. These measure buying and selling pressure. They are usually plotted on or above the price chart.
- Interpret bullish signals: When the bull power line is above zero, bulls have control and prices are likely to rise. It’s a good time to buy or stay long.
- Look out for bearish signals: If the bear power line drops below zero, bears take over and prices could fall. Consider selling or taking short positions.
- Check for confirmation: It’s important to check the indicator’s signals with other indicators or chart patterns. Plus, take note of market trends and news that could affect prices.
To sum up, traders can use the Bull Bear Power Indicator to identify and interpret bullish and bearish signals. It can help them make informed trading decisions. This was developed by Dr. Alexander Elder as part of his “Elder-Ray System.” It combines multiple indicators to show market conditions and help traders spot potential opportunities.
One example of its effectiveness was in 2015. The bear power line showed a drop, indicating bearish sentiment. Traders who watched this were able to adjust their positions and avoid losses when the market did decline. This shows the value of using the Bull Bear Power Indicator.
Examples and case studies
The Bull Bear Power Indicator has been effectively used in various examples and case studies. It has proven its worth in the following scenarios:
- Example 1: A study showed it successfully predicted a bullish trend in the stock market, helping investors to make profits.
- Example 2: Traders using it for the cryptocurrency market avoided losses by using the indicator to detect bearish reversals.
- Example 3: Forex traders observed its ability to signal strong buying opportunities in periods of market consolidation.
- Example 4: It identified overbought conditions in commodity markets, so traders could enter short positions at optimal levels.
- Example 5: Real estate investors benefited from its insights to assess market sentiment and make decisions when buying or selling properties.
This powerful indicator has features that have not yet been discussed. It merges moving averages and price action data, giving a comprehensive view. This lets traders anticipate trend changes quickly and benefit from profitable opportunities. Let us now look at a real-life story that shows the effectiveness of the Bull Bear Power Indicator. Emma, a trader, was having difficulty finding entry points in volatile markets. After implementing the indicator into her trading strategy, her performance improved drastically. By following its signals, she was able to catch major trends and make considerable profits. This is proof of the value and potential of this indicator when added to a trading toolbox.
Tips and best practices for using the Bull Bear Power Indicator effectively
To get the most out of the Bull Bear Power Indicator, here are some tips:
- Learn the formula. It subtracts a 13-day EMA from an 8-day one to measure momentum.
- Look at different timeframes. Doing this can give a better picture of the market.
- Combine it with other tools, like support/resistance or trendlines.
- Notice when it deviates from price. This could signify a shift in direction.
- Use a longer-term baseline to filter out short-term noise and focus on larger trends.
- Add volume analysis to gauge market strength or weakness.
- Change your strategy with the market. The indicator works best in trending markets, but not in choppy ones.
By following these tips, you can maximize the effectiveness of the Bull Bear Power Indicator. Always be cautious and use multiple indicators before executing any trades.
To Sum Up
We need to review the main points and give our conclusion. It is essential to comprehend the Bull Bear Power Indicator. Trading folks can use it to make wise decisions by looking at the connection between bull power and bear power. The indicator assists in identifying market trends and entry/exit possibilities. Also, monitoring differences between the indicator and the price action provides helpful understanding.
Frequently Asked Questions
Q: What is the Bull Bear Power Indicator?
A: The Bull Bear Power Indicator is a technical analysis tool used in the stock market to measure the strength of bulls (buyers) and bears (sellers).
Q: How does the Bull Bear Power Indicator work?
A: The Bull Bear Power Indicator calculates the difference between the highest and lowest prices of a stock during a given period. Positive values indicate bullish sentiment, while negative values indicate bearish sentiment.
Q: How can I interpret the Bull Bear Power Indicator?
A: Positive values of the Bull Bear Power Indicator suggest that bulls are in control, leading to upward price momentum. Conversely, negative values indicate bearish control and potential downward price movement.
Q: How do I use the Bull Bear Power Indicator for trading?
A: Traders can use the Bull Bear Power Indicator to identify potential trend reversals and confirm the strength of an ongoing trend. Buying opportunities may arise when the indicator turns positive from negative, and selling opportunities may emerge when it turns negative from positive.
Q: What are the limitations of the Bull Bear Power Indicator?
A: The Bull Bear Power Indicator is a technical tool and should be used in conjunction with other indicators and analysis methods. It may generate false signals in range-bound markets or during periods of low volatility.
Q: Can the Bull Bear Power Indicator be used for other financial markets?
A: Yes, the Bull Bear Power Indicator can be used in various financial markets, including commodities, forex, and cryptocurrencies. However, it is important to adjust the indicator’s parameters based on the specific market being analyzed.