The Divergence Indicator is an awesome tool to build up your trading strategy. It can recognize divergences in prices, giving you great knowledge about market trends and potential changes. This article explains how to use it correctly.
What’s divergence? It happens when the price of an asset moves differently than a technical indicator. Spotting these divergences can help traders take advantage of great trading chances.
Using the Divergence Indicator is easy. You only have to put it on your trading platform. After that, you can pick a chart or timeframe. The indicator will draw lines showing the difference between prices and a technical indicator, such as MACD or RSI.
When using the Divergence Indicator, you should search for regular and hidden divergences. Regular ones appear when price makes higher highs or lower lows while the indicator doesn’t follow the same pattern. This shows a potential reversal in the market. Hidden divergences come up when price makes lower highs or higher lows but the indicator fails to do so. This means the trend is likely to continue.
To get the most out of this tool, you should mix it with other indicators and analysis methods. It will help you boost the accuracy of your trades. Plus, you should always use risk management techniques when trading based on divergence signals.
What is the Divergence Indicator?
The Divergence Indicator can be a huge help for traders. It helps them spot potential trend reversals and market fluctuations. This is done by comparing the movement of an oscillator, like RSI or MACD, to the chart’s price action. A disagreement or divergence between these two could mean a change in direction.
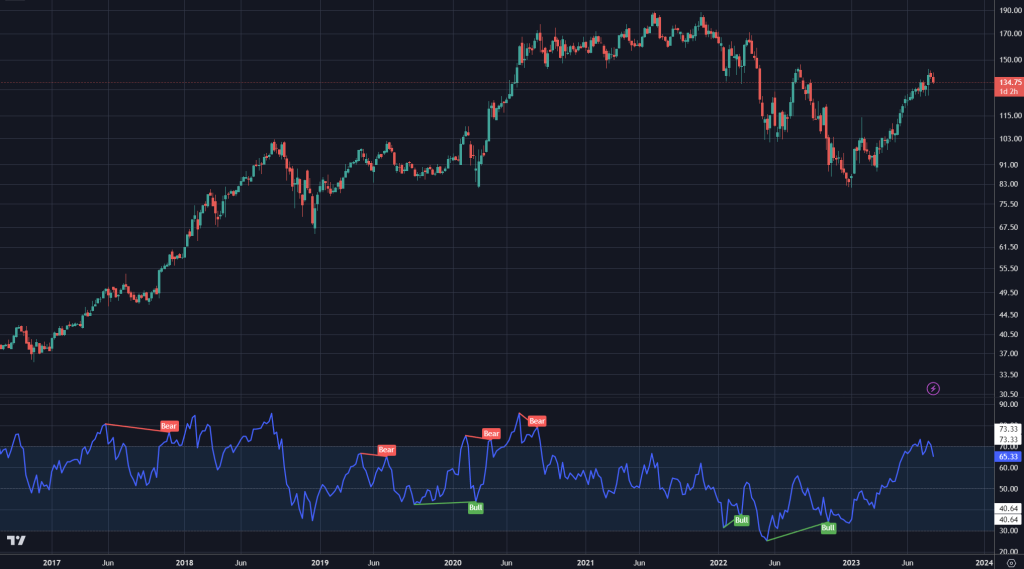
It can also help traders spot bullish or bearish divergences. A bullish divergence shows a lower low on the price chart, but a higher low on the indicator. This suggests that selling pressure might be reducing and an upward move is possible. A bearish divergence is a higher high on the price chart, but a lower high on the indicator. This suggests that buying pressure might be weak and a downward move could occur.
Divergence has been used in technical analysis for many years. It can give traders an edge when predicting market reversals and making successful trades.
Understanding the Importance of the Divergence Indicator
The Divergence Indicator is a must-have for traders. It analyzes the gap between price movements and technical indicators. This helps pinpoint possible trend shifts, so traders can enter/exit positions at the best time.
It also detects divergences between price and oscillators/indicators like RSI and MACD. This is useful for finding both bullish and bearish prospects.
To get the most out of the Divergence Indicator, it’s important to understand how it ties in with other tech analysis tools. Combining it with support/resistance levels, trend lines, and candle patterns can make it better. Plus, different timeframes can give different signals.
Tip: The Divergence Indicator is only one of many tools. To get a full grasp of the market, use it with other indicators and analysis techniques.
Step-by-Step Instructions on How to Use the Divergence Indicator
The divergence indicator can be a great asset to traders who wish to recognize potential market reversals. By analyzing price movement and comparing it to other indicators, traders can get useful knowledge about the momentum and direction of a certain asset. To make use of this indicator successfully, you should:
- Spot divergences: Look for situations where the price of an asset is going in the opposite direction of an oscillator, like the Relative Strength Index (RSI) or Moving Average Convergence Divergence (MACD). These divergences show a probable change in market sentiment and can be used as an early warning sign for a trend reversal.
- Confirm with extra indicators: Even though divergences can give useful signals on their own, it’s always beneficial to back them up with other technical indicators. This could be trend lines, support and resistance levels, or volume analysis. By working with multiple indicators, traders can enhance the accuracy of their forecasts and reduce false signals.
- Take action: After a divergence has been discovered and confirmed, it’s time to act. Traders may decide to open a trade in the opposite direction of the existing trend or adjust their current positions accordingly. Stop-loss orders should also be taken into account to manage risk properly.
Besides these steps, it’s important to keep in mind that divergences are not infallible signals but instead signs of potential opportunities. Flourishing trading requires self-control and thoughtful thought of other aspects such as market conditions and fundamental analysis.
Interestingly, the concept of divergence analysis has been around for many years and has its origins in traditional technical analysis techniques. Over time, traders have created numerous indicators and methods to help identify divergences more effectively. The divergence indicator itself is a modern tool that simplifies this process by scanning price data automatically and pointing out potential divergences.
Common Mistakes to Avoid when Using the Divergence Indicator
Using the Divergence Indicator may appear easy, but traders often make mistakes. These blunders can lead to wrong signals and misreading of market trends. One blunder to evade is just depending on the Divergence Indicator without considering other technical analysis tools. Though the indicator can give helpful insights, it should be utilized alongside other indicators or chart patterns to confirm trends. Another error is not understanding the distinct types of divergence. There are two main types: bullish divergence and bearish divergence. Traders need to be aware of these contrasts and interpret them rightly to make wise trading decisions. Furthermore, overlooking the timeframe can also bring about errors when using the Divergence Indicator. Different timeframes can produce clashing signals, so it’s essential to mull over the overall trend and not focus only on short-term divergences. In addition to bypassing these common mistakes, there are a few tips that can aid traders to get the most out of the Divergence Indicator.
- It’s significant to use multiple timeframes when studying divergences. This helps to eliminate false signals and gives a more wide-ranging view of the market.
- Uniting the indicator with other technical analysis instruments such as support and resistance levels can enhance its accuracy. These additional tools provide confirmation or contradiction of divergences, cutting down possible false signals.
Also, traders should always exercise suitable risk management techniques when using the Divergence Indicator. Setting appropriate stop-loss orders and having a clear exit strategy helps reduce potential losses in case the indicator does not perform as expected. By avoiding common mistakes and following these tips, traders can use the Divergence Indicator efficiently and make more informed trading decisions in various market conditions.
Advanced Tips and Techniques for Maximizing the Divergence Indicator’s Potential
The Divergence Indicator is an incredible tool for traders aiming to maximize profits. Learn how to use this indicator to gain insights into market trends and make informed trading calls. Here are some advanced tips:
| Tip 1: Try Different Timeframes | Analyze divergences on different timeframes for a better understanding of market trends. This could unearth high-probability trading opportunities. |
| Tip 2: Employ Other Indicators | The Divergence Indicator works great when used in combination with other indicators. This can give further confirmation to your trades. |
| Tip 3: Look for Convergence | Apart from diverging trends, watch out for convergence. When price and indicator movements meet, it may signal a reversal or trend continuation. |
| Tip 4: Risk Management Matters | No matter how accurate your analysis is, there is always a risk involved in trading. Set stop-loss orders and manage your position sizes to protect your capital. |
Also, stay updated with latest market news and developments. Keep an eye out for economic indicators and any upcoming events that may affect the markets.
A pro tip: Test your strategies before implementing them in live trading. This allows you to assess the effectiveness of the Divergence Indicator in different market conditions and improve your trading approach.
By incorporating these techniques into your trading strategy, you can unlock the full potential of the Divergence Indicator and increase your chances of success. Good luck!
To Sum Up
The Divergence Indicator gives traders a great view of potential market reversals. It looks for differences in price movements and other indicators. Knowing how to use the indicator can improve trading strategies.
Analyzing diversities can give traders better knowledge of market dynamics. Comparing prices and technical indicators, such as RSI or MACD, can give traders an idea of potential trend changes. This can be used for smarter trading decisions and better entries and exits.
It is important to notice both bullish and bearish divergences. Bullish divergences show the possibility of an upward trend, while bearish divergences suggest a downward trend. Notice these patterns early to benefit from profitable opportunities.
It is not wise to only depend on the Divergence Indicator. It is better to combine signals with other technical analysis tools and take fundamental analysis into account to get a full picture of the market.
Frequently Asked Questions
FAQ:
1. What is the Divergence Indicator?
The Divergence Indicator is a technical analysis tool that helps traders identify potential trend reversals in the market by comparing price movements with an accompanying indicator.
2. How does the Divergence Indicator work?
The Divergence Indicator looks for divergences between price and an indicator, such as the MACD or RSI. A bullish divergence occurs when price makes lower lows while the indicator makes higher lows, indicating a potential upward reversal. A bearish divergence occurs when price makes higher highs while the indicator makes lower highs, signaling a potential downward reversal.
3. How can I use the Divergence Indicator in my trading strategy?
You can use the Divergence Indicator to confirm potential trade setups or signal reversals. For example, if you see a bullish divergence, it could be a signal to go long. You can also use it to exit existing positions, as a bearish divergence might indicate a trend reversal and a potential sell opportunity.
4. Which indicators work best with the Divergence Indicator?
The Divergence Indicator can be used with various oscillators like MACD, RSI, or Stochastic. However, the choice of indicators depends on personal preference and trading style. It’s recommended to experiment with different indicators to find the ones that work best for you.
5. Can the Divergence Indicator be used in any market?
Yes, the Divergence Indicator can be used in any market, including stocks, forex, cryptocurrencies, and commodities. As long as there is sufficient volume and price movements, the indicator can help identify potential reversals.
6. Are there any limitations or risks associated with the Divergence Indicator?
Like any technical analysis tool, the Divergence Indicator is not foolproof and should be used in conjunction with other analysis techniques. It’s important to consider other factors such as market conditions, support and resistance levels, and fundamental analysis. Additionally, false signals can occur, so it’s essential to practice proper risk management and use stop-loss orders.