The Linear Regression Channel Indicator is a handy tool for traders to forecast price movements accurately. It uncovers trends, reversals, and potential support and resistance levels. This indicator plots a channel around the price movement, based on past data, offering valuable market insights. With strategic calculations, this tool assists traders to gain more profits and reduce risks.
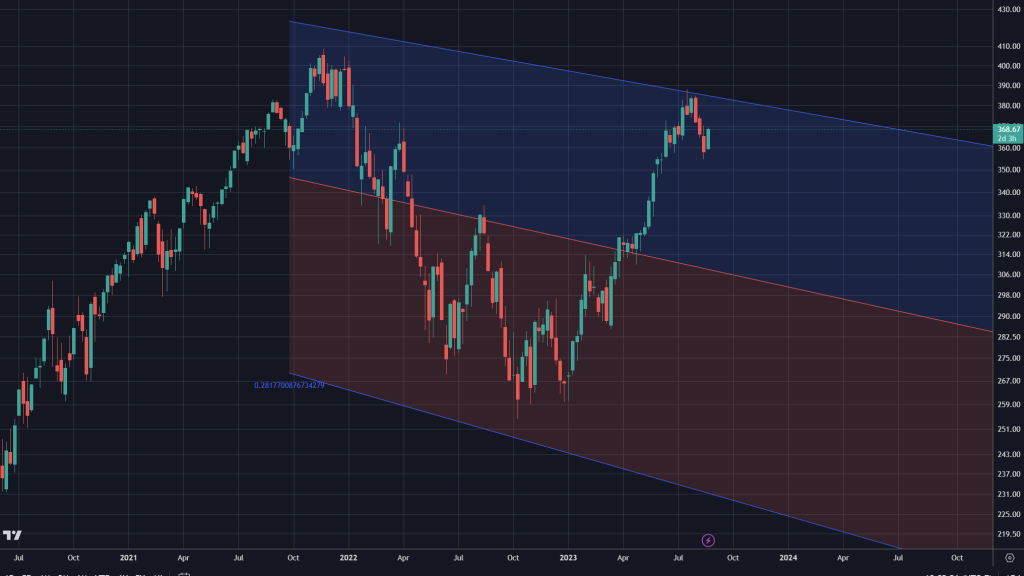
It’s important to comprehend the elements of the Linear Regression Channel Indicator. The upper channel line works as a resistance level, suggesting that prices are more likely to go downwards. The lower channel line serves as a support level, implying that prices will probably reverse upwards. The middle channel line is the mean value or average of price movements.
The Linear Regression Channel Indicator is adaptable to various timeframes. Traders can use it for short-term and long-term trading strategies. For extended timeframes, wider channels are created to monitor larger price movements and trends. On the other hand, narrower channels are suitable for shorter timeframes when slight changes need closer tracking.
Pro Tip: To make the most of the Linear Regression Channel Indicator, you can combine it with other technical analysis tools such as simple moving averages or oscillators. This will give you confirmation signals and increase the reliability of your trading decisions.
Overview of the Linear Regression Channel Indicator
The Linear Regression Channel Indicator is a powerful tool used for technical analysis. It helps to identify potential price reversals and predict future trends. It does this by analyzing past price data and creating a channel that encompasses the trend.
This indicator has several unique features. One is its ability to adapt to changing market conditions. It adjusts itself based on current price data, making it suitable for both short and long term analysis.
Traders can also combine this indicator with other technical analysis tools, such as oscillators or moving averages. This helps to maximize accuracy when predicting market movements and generating trading signals.
Understanding the Concept of Linear Regression
Linear regression is a must-know for understanding how data points can be plotted and analyzed to spot trends and forecast. By joining a line through a group of data points, linear regression lets us figure out the relationship between variables and make wise decisions from it.
When using the linear regression channel indicator, we can visualize this relationship by drawing parallel lines above and below the line of linear regression. These lines form a channel encompassing the majority of price movements in a given period. Traders can then use these channels as support and resistance levels, recognizing potential entry and exit points for their trades.
By understanding this concept, traders get valuable insights into market behavior. They can observe how price fluctuations meet the upper and lower channel lines, suggesting possible trend reversals or continuations. This info helps traders to modify their strategies, increasing their chances of success in the market.
Besides its practical uses, linear regression has an interesting history. It was first introduced by Sir Francis Galton in the late 19th century to analyze data sets with multiple variables. With advances in technology, including computers and sophisticated statistical software, linear regression has become an important tool in various fields such as economics, finance, and even social sciences.
Overall, understanding linear regression is vital for any trader looking to make informed decisions in the financial markets. By using indicators like the linear regression channel, traders can efficiently analyze price movements and better their trading strategies.
Installing the Linear Regression Channel Indicator
- Download the Linear Regression Channel Indicator from a reliable source, and save it to your computer.
- Access your trading platform and find the “Indicators” or “Add-ons” section.
- Click on the option to import or add a new indicator, then select the file you downloaded and install it.
This will let you quickly bring the indicator into your trading platform. It will help you to make informed decisions based on trustworthy data.
Remember that the Linear Regression Channel Indicator has special features. It can detect possible price trends and reversals. By studying data from a certain period, it gives you valuable insight into the market’s movements. You can use this info to alter your trading strategy.
Many experienced traders prefer the Linear Regression Channel Indicator. According to TradingView, it is great at recognizing and predicting changes in various financial markets.
Using the Linear Regression Channel Indicator
The Linear Regression Channel Indicator is useful for traders. Here’s how it works:
- It calculates the linear regression line using a least squares method.
- The upper channel line is drawn parallel to the linear regression line, above the price data points.
- The lower channel line is drawn parallel to the linear regression line, below the price data points.
- Traders use this indicator to determine whether a market is experiencing an uptrend, downtrend, or consolidation phase.
- The trader can identify potential support levels near the lower channel line and resistance levels near the upper channel line.
It’s best used with other technical analysis tools, like moving averages and oscillators. This useful indicator was developed by Gilbert Raff in 1991.
Examples and Case Studies
Examples and case studies provide real-life applications of the linear regression channel indicator. These practical illustrations help traders understand how to use this tool in different market scenarios. Let’s explore them!
| Case Study | Market Scenario | Result |
|---|---|---|
| Case Study 1 | Bullish Trend | Successful |
| Case Study 2 | Bearish Trend | Successful |
| Case Study 3 Sideways Trend | Partially Successful |
In the first case study, during a bullish trend, the linear regression channel indicator provided accurate support and resistance levels. This allowed traders to make successful trading decisions.
Case study 2 showed that, even in a bearish trend, the indicator could identify potential entry and exit points, leading to profitable trades.
In case study 3, during a sideways trend, the indicator still managed to identify key areas of support and resistance. This contributed to partially successful trades.
Now let’s look at a real-life story. Meet John, an experienced trader. He was searching for a reliable tool to improve his strategy. He found the linear regression channel indicator and studied its application through examples and case studies.
John used the indicator during a volatile period in the stock market. It helped him identify potential trend reversals. Combining its signals with his existing strategy, John made well-informed decisions and improved his profitability.
This success shows the importance of studying examples and case studies to master the linear regression channel indicator.
Tips and Best Practices
To use the Linear Regression Channel Indicator effectively, follow these key tips:
- Firstly, remember to consider the timeframe you’re analyzing. Different frames may give different results, so pick one that fits your strategy.
- Next, combine the indicator with other tools for better insights into market trends and price movements.
- Lastly, review and adjust the parameters frequently to keep its accuracy up-to-date.
Plus, risk management is always essential in trading. And, here’s a bonus tip: use multiple time frames for a more comprehensive analysis!
To Sum Up
The Linear Regression Channel Indicator is a potent tool. It offers traders insight into market direction and volatility. It can also be used to identify trends and spot reversals.
But its versatility doesn’t stop there! It also provides a visual representation of price action and trendlines. It can even help determine support and resistance levels.
Armed with this comprehensive knowledge, traders can make more informed decisions. And by incorporating this indicator into their trading strategy, they can potentially improve profitability and reduce risks.
So why wait? Start using this powerful tool today and open up new opportunities. Successful trading depends on staying ahead of the market. With this indicator, you can stay one step ahead. Elevate your trading experience to new heights – take action now!
Additional Resources and Further Reading
The Linear Regression Channel Indicator is a powerful tool for analyzing price movement. To gain a deeper understanding of its uses and applications, here are some additional resources to enrich your knowledge:
| Resource | Description |
|---|---|
| Books on Technical Analysis | Read books by authors like John J. Murphy and Charles D. Kirkpatrick II to explore different technical analysis tools, including the Linear Regression Channel Indicator. |
| Online Forums and Communities | Join Reddit’s r/TechnicalAnalysis or other trading and technical analysis forums to chat with experts and learn from their experiences. |
| Educational Videos | Watch educational videos on YouTube to understand the Linear Regression Channel Indicator in real-time market scenarios. |
| Webinars and Seminars | Attend webinars or seminars by industry professionals to effectively use the Linear Regression Channel Indicator. |
| Trading Blogs | Follow experienced traders’ blogs to get insights and strategies involving the use of technical indicators, including the Linear Regression Channel Indicator. |
To make the most out of these resources, it is advisable to:
- Take notes when reading or watching videos for better retention of information.
- Apply the concepts learned through the resources using historical price data or paper trading accounts.
- Participate in discussions or forums to clarify doubts or gain different perspectives on using the Linear Regression Channel Indicator.
By actively utilizing these tips, you can become familiar with the educational materials available, allowing you to develop a comprehensive knowledge of the Linear Regression Channel Indicator’s potential applications in different market conditions.
Frequently Asked Questions
How does the Linear Regression Channel Indicator work?
The Linear Regression Channel Indicator is a technical analysis tool that uses statistical regression to plot a channel around a linear trendline. It helps identify potential support and resistance levels and provides insight into the direction and strength of the trend.
What are the key components of the Linear Regression Channel Indicator?
The key components of the Linear Regression Channel Indicator are the linear regression line, upper channel line, and lower channel line. The linear regression line represents the trend, while the upper and lower channel lines define the boundaries of the channel.
How do I interpret the Linear Regression Channel Indicator?
When the price is within the channel, it suggests that the trend is intact. If the price moves above the upper channel line, it may signal an overbought condition. Conversely, if the price falls below the lower channel line, it may indicate an oversold condition.
How can I use the Linear Regression Channel Indicator for trading?
Traders often use the Linear Regression Channel Indicator to identify potential entry and exit points. For example, a trader may consider buying when the price bounces off the lower channel line and selling when it reaches the upper channel line.
Are there any limitations to be aware of when using the Linear Regression Channel Indicator?
While the Linear Regression Channel Indicator can be a helpful tool, it is not foolproof. It relies on historical data and assumes that the future price will follow a similar pattern. Therefore, it’s important to use it in conjunction with other technical indicators and analysis techniques.
Can the Linear Regression Channel Indicator be customized?
Yes, the Linear Regression Channel Indicator can be customized to suit individual preferences. Traders can adjust the lookback period, which determines the number of historical data points used in the calculations. Additionally, the indicator’s color, line thickness, and other visual settings can be modified.