The price oscillator is a great tool for traders and investors to analyze the market. It tracks the difference between two moving averages of prices, helping to identify overbought and oversold conditions. This intro will explain how to use it in trading strategies.
This indicator reveals market momentum and potential reversals. It shows the convergence and divergence of prices, indicating possible entry/exit points. And it works across different time frames – daily, weekly, or monthly. This flexibility gives traders an edge in understanding market dynamics.
Marc Chaikin developed the price oscillator in the 1980s. He was an expert in stock analysis and market indicators. He wanted to measure momentum using moving averages. His work is known and appreciated by traders worldwide.
Definition and Explanation of the Price Oscillator
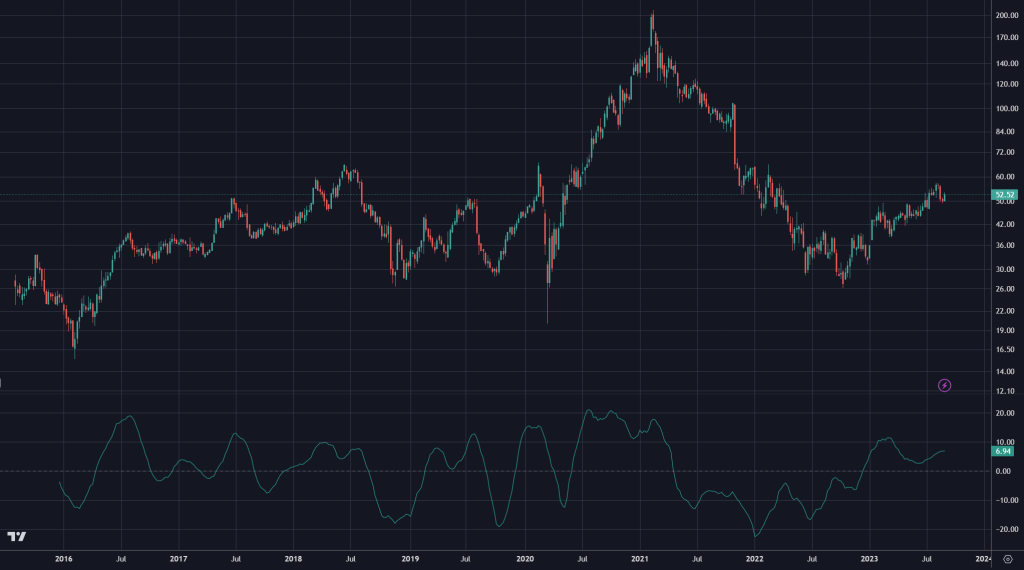
The price oscillator is a tool used in technical analysis to identify trends and potential turning points. It plots the difference between two moving averages of a financial asset’s price on a chart. If the line is above zero, it indicates bullish momentum; below zero, bearish momentum. Uniquely, it can provide divergences. These occur when the asset makes new highs/lows, but the oscillator doesn’t confirm them. This can signal potential reversals, giving traders a chance to take advantage before the move. Traders also use the price oscillator as a confirmation tool. For example, if they see a bullish signal on a chart pattern, they can check the oscillator before entering a trade.
Benefits of Using the Price Oscillator
The Price Oscillator is a must-have for traders! It offers a variety of key advantages, such as:
- Identifying Trends: The Price Oscillator can detect patterns in the market, allowing traders to make smart choices about price movement.
- Confirming Reversals: Comparing the oscillator against price can confirm potential reversals, giving traders an edge.
- Generating Buy and Sell Signals: The Price Oscillator can deliver buy and sell signals when it reaches zero or other pre-set levels, helping traders act at the right time.
- Detecting Overbought and Oversold Conditions: Traders can use the Price Oscillator to identify when the market is overbought or oversold, which can help adjust their positions or enter new trades.
- Filtering Market Noise: The Price Oscillator can filter out short-term market noise, allowing traders to focus on long-term trends and make better decisions.
- Setting Profit Targets: By studying the oscillations in the Price Oscillator, traders can set profit targets, ensuring they capture the right amount of market movement before exiting.
Not only that, but this tool is great for all types of traders! Beginners and experts alike can use it across different time frames and markets. So don’t miss out on the power of the Price Oscillator. Utilize it to get valuable insights into market trends, increase your profitability, and stay ahead of the competition. Start using it now and take your trading to the next level!
Step-by-step Guide on how to Use the Price Oscillator
Using the Price Oscillator can be useful. Here’s a step-by-step guide:
- Step 1: Choose a time period. It can be short or long-term, depending on your strategy.
- Step 2: Calculate the EMAs for the chosen time period, usually 12-day and 26-day EMAs.
- Step 3: Work out the Price Oscillator values by subtracting the longer-term EMA from the shorter-term one.
- Step 4: Notice any divergences between the price movements and the oscillator. A positive divergence suggests that prices are making lower lows, while the oscillator makes higher lows, which could mean a reversal. On the other hand, negative divergence could indicate an upcoming downward trend.
- Step 5: To increase accuracy, use other indicators such as volume or trend lines.
Moreover, using multiple oscillators can give more information without causing confusion.
It’s worth noting that Investopedia states that the Price Oscillator can help traders identify overbought and oversold levels in various market conditions.
Tips and Strategies for Maximizing the Effectiveness of the Price Oscillator
The price oscillator is a great tool for understanding market trends. Here’s how to get the best out of it:
- Look at multiple timeframes. This gives you a better idea of what’s happening in the market.
- Change the settings to best suit your style and market conditions.
- Combine with other technical analysis tools, for example, moving averages or trendlines.
- Watch for divergences from the price oscillator and the actual price movements. These could signal reversals or trend changes.
- Manage risk with stop-loss orders.
- Keep up with market news. It might change how the oscillator works.
Practice and experience are essential to interpreting the price oscillator. Monitor the signals, analyze historical data, and you’ll soon get the hang of it. With the right strategies, you’ll be able to make use of the price oscillator more effectively.
Common Mistakes to Avoid when Using the Price Oscillator
Using the Price Oscillator can be challenging. But avoiding mistakes will help you make more precise forecasts. Here are some key points to bear in mind:
- Don’t use the Price Oscillator alone; combine it with other technical analysis tools to double-check your findings.
- Change the settings of the Price Oscillator based on whether you’re analysing daily, weekly, or monthly data.
- Don’t depend on the Price Oscillator alone for entry and exit points. Consider additional factors such as market trends, volume patterns, and news events.
- Watch out for divergences between the Price Oscillator and price action. These often indicate potential reversals.
- Note overbought and oversold conditions shown by extreme values on the Price Oscillator, so you can anticipate potential reversals.
Also, it’s important to understand market dynamics to interpret the Price Oscillator correctly. Practise using it with other technical indicators and refine your skills over time.
To optimise your use of the Price Oscillator, try these tips:
- Combine it with other indicators: Use complementary tools like moving averages or trend lines to confirm before trading.
- Test different parameter settings: Try various period combinations within the oscillator to see what works best for each timeframe and market condition.
- Exercise extra caution during low-volume periods: Prices can be manipulated during thin trading activity, so double-check signals from the oscillator.
- Combine insights with support/resistance levels: Enhance accuracy by combining the Price Oscillator with key support and resistance levels.
By following these tips, you’ll be able to utilise the Price Oscillator more effectively. This could improve your decision-making process and possibly increase your trading success. Keep in mind, practice and adaptability are essential when employing any technical indicator.
To Sum Up
Exploring the Price Oscillator reveals its immense potential for traders. It helps to identify overbought/oversold conditions and can generate signals in both bullish and bearish markets. Hence, this oscillator truly empowers traders through valuable insights.
What sets it apart is its calculation of changes as percentages rather than absolute values – allowing for better comparison across different timeframes. Combining longer and shorter moving averages also adds depth to its analysis.
John Longo pioneered the development of this indicator in the early 1980s. His dedication led to successful application and today it’s a popular tool amongst traders worldwide. The Price Oscillator remains an evolving asset in their arsenals.
Frequently Asked Questions
FAQ 1: What is a Price Oscillator?
Answer: A Price Oscillator is a technical analysis tool used to track the momentum and strength of a security by comparing its current price to a historical average.
FAQ 2: How does a Price Oscillator work?
Answer: A Price Oscillator subtracts a longer-term moving average from a shorter-term moving average to generate oscillating values above and below a zero line, indicating overbought or oversold conditions.
FAQ 3: What are the main components of a Price Oscillator?
Answer: The main components of a Price Oscillator are the short-term moving average, long-term moving average, and the zero line.
FAQ 4: How can I interpret the Price Oscillator?
Answer: When the Price Oscillator crosses above the zero line, it suggests a bullish trend, whereas crossing below the zero line indicates a bearish trend. Divergence between the Price Oscillator and price movement can also highlight potential trend reversals.
FAQ 5: What are the common timeframes used for Price Oscillators?
Answer: Common timeframes used for Price Oscillators include 12-day and 26-day moving averages, but variations like 14-day and 9-day averages can also be applied.
FAQ 6: Are there any limitations to using a Price Oscillator?
Answer: Yes, Price Oscillators may generate false signals during periods of low volatility, and they should be used in conjunction with other technical indicators and analysis tools for confirmation.