The True Strength Index (TSI) is a technical indicator that helps traders identify the strength of a trend. It does this by comparing the average gain of an asset over a certain period to its average loss over the same period. The TSI is a momentum oscillator that oscillates around a centerline, making it easy to read and interpret. In this article, we will discuss how to use the True Strength Index Indicator to make informed trading decisions.
Understanding the True Strength Index Indicator is key to using it effectively. The TSI calculation involves two moving averages, one for the price change and one for the absolute price change. The difference between these two moving averages is then divided by the absolute price change moving average to arrive at the TSI value. The TSI is plotted as a line that oscillates around a centerline, with values above the centerline indicating bullish momentum and values below the centerline indicating bearish momentum.
Setting up the True Strength Index Indicator is a straightforward process. Most trading platforms have the TSI indicator built-in, so all you need to do is add it to your chart. Once you have added the indicator, you can adjust the period lengths to suit your trading style. Shorter periods will be more sensitive to price changes, while longer periods will be more stable and reliable. By understanding how the TSI is calculated and setting it up correctly, traders can begin to use this powerful indicator to make informed trading decisions.
Key Takeaways
- The True Strength Index (TSI) is a momentum oscillator that helps traders identify the strength of a trend.
- Understanding the TSI calculation and setting it up correctly is key to using it effectively.
- Traders can use the TSI to make informed trading decisions by interpreting its values and applying it to their trading strategy.
Understanding the True Strength Index Indicator
The True Strength Index (TSI) is a technical analysis indicator that measures the strength of a security’s price action. It was developed by William Blau in the early 1990s and is based on the difference between two exponentially smoothed moving averages of price data.
The TSI indicator oscillates around a zero line, and its value is represented by a histogram. When the TSI is above the zero line, it indicates that the bullish momentum is stronger than the bearish momentum. Conversely, when the TSI is below the zero line, it suggests that the bearish momentum is stronger than the bullish momentum.
The TSI indicator is useful for identifying trends, momentum, and potential trend reversals. It can also be used to confirm price action signals from other technical analysis indicators. For example, if a security’s price is making higher highs, but the TSI is making lower highs, it could be a sign that the bullish momentum is weakening, and a potential trend reversal may be imminent.
The TSI indicator can be customized by adjusting its parameters, such as the length of the moving averages used in its calculation. Traders can experiment with different settings to find the optimal values for their trading strategies.
Overall, the TSI indicator is a valuable tool for technical analysts who want to gain insights into the strength of a security’s price action. By understanding how the TSI works and how to interpret its signals, traders can make informed trading decisions and improve their chances of success in the markets.
Setting Up the True Strength Index Indicator
To set up the True Strength Index (TSI) indicator, the user must first select the TSI indicator from the list of available indicators on their trading platform. Once selected, the user can adjust the indicator’s settings to their preferred values.
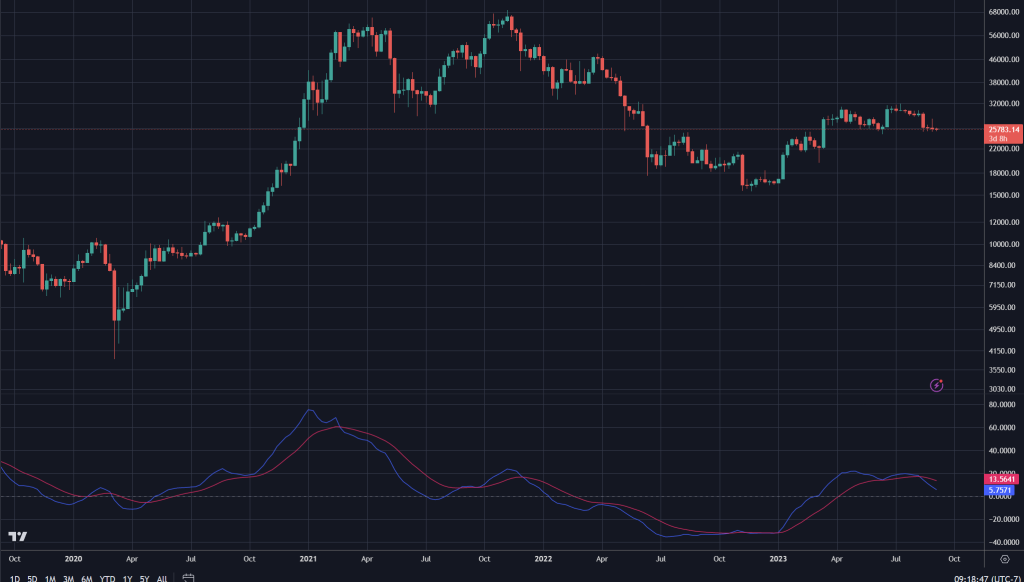
The TSI indicator has two main parameters that need to be set: the short-term smoothing period and the long-term smoothing period. The short-term smoothing period is typically set to 13, while the long-term smoothing period is set to 25. However, these values can be adjusted based on the trader’s preference and the market being traded.
Additionally, the user can adjust the TSI’s signal line by setting the signal smoothing period. This line is typically set to a value of 7. The signal line can be used to generate trading signals when it crosses above or below the TSI line.
It is important to note that the TSI indicator is best used in conjunction with other technical indicators and analysis tools. Traders should not rely solely on the TSI indicator to make trading decisions.
Overall, setting up the TSI indicator is a straightforward process that can be easily accomplished by traders of all skill levels. By adjusting the indicator’s settings and using it in conjunction with other analysis tools, traders can gain valuable insights into market trends and make more informed trading decisions.
Interpreting the True Strength Index Indicator
Overbought and Oversold Levels
The True Strength Index (TSI) indicator can be used to identify overbought and oversold conditions in the market. When the TSI rises above a certain level, it indicates that the market is overbought and may be due for a correction. Conversely, when the TSI falls below a certain level, it indicates that the market is oversold and may be due for a rebound. Traders can use these levels to enter or exit trades, depending on their trading strategy.
Divergence
Divergence is another way to interpret the TSI indicator. When the price of an asset is moving in one direction, but the TSI is moving in the opposite direction, it is called divergence. This can be a sign that the trend is weakening and may be due for a reversal. Traders can use divergence to identify potential trading opportunities and adjust their positions accordingly.
Centerline Crossover
The centerline crossover is a popular way to interpret the TSI indicator. When the TSI crosses above the centerline, it indicates that the asset’s momentum is bullish, and traders may consider buying. Conversely, when the TSI crosses below the centerline, it indicates that the asset’s momentum is bearish, and traders may consider selling. The centerline crossover can be used in combination with other technical indicators to confirm trading signals.
Overall, the TSI indicator can be a valuable tool for traders looking to identify trends and potential trading opportunities. However, it is important to use the TSI in conjunction with other technical indicators and to have a solid understanding of market conditions before making trading decisions.
Applying the True Strength Index Indicator
The True Strength Index (TSI) indicator is a versatile technical analysis tool that can be used to identify trends, trade entry points, and exit strategies. Here are some ways to apply the TSI indicator:
Trend Identification
The TSI indicator can be used to identify the direction of the trend. When the TSI line is above the signal line, it indicates that the trend is bullish. Conversely, when the TSI line is below the signal line, it indicates that the trend is bearish. Traders can use this information to enter trades in the direction of the trend.
Trade Entry Points
The TSI indicator can also be used to identify trade entry points. Traders can look for bullish or bearish divergences between the TSI indicator and price. A bullish divergence occurs when the price makes a lower low, but the TSI indicator makes a higher low. This is a sign that the price may reverse and move higher. Conversely, a bearish divergence occurs when the price makes a higher high, but the TSI indicator makes a lower high. This is a sign that the price may reverse and move lower.
Exit Strategies
The TSI indicator can also be used to identify exit strategies. Traders can use the TSI indicator to identify overbought or oversold conditions. When the TSI line crosses above the overbought level, it indicates that the price may be due for a reversal. Conversely, when the TSI line crosses below the oversold level, it indicates that the price may be due for a reversal. Traders can use this information to exit trades and take profits.
In summary, the TSI indicator is a powerful tool that can be used to identify trends, trade entry points, and exit strategies. Traders can use this information to make informed trading decisions and improve their trading results.
Advantages of Using the True Strength Index Indicator
The True Strength Index (TSI) indicator is a popular technical analysis tool used by traders and investors to identify trends and make informed trading decisions. Here are some advantages of using the TSI indicator:
1. Provides Early Signals
The TSI indicator is designed to provide early signals of trend changes. It uses a combination of moving averages and momentum to identify trend reversals, which can help traders enter or exit positions at the right time. This can minimize losses and maximize profits.
2. Smooths Out Price Data
The TSI indicator smooths out price data, making it easier to identify trends. This can help traders avoid false signals and make more accurate predictions about future price movements.
3. Works Well with Other Indicators
The TSI indicator can be used in conjunction with other technical analysis tools, such as moving averages, trend lines, and support and resistance levels. This can help traders confirm signals and make more informed trading decisions.
4. Customizable Settings
The TSI indicator is highly customizable, allowing traders to adjust the settings to suit their individual trading styles and preferences. This can help traders fine-tune their strategies and improve their overall performance.
Overall, the TSI indicator can be a valuable tool for traders and investors looking to identify trends and make informed trading decisions. By providing early signals, smoothing out price data, working well with other indicators, and offering customizable settings, the TSI indicator can help traders improve their trading performance and achieve their financial goals.
Limitations of the True Strength Index Indicator
While the True Strength Index (TSI) can be a useful tool in technical analysis, it is important to understand its limitations. Here are some of the key limitations of the TSI:
1. Lagging Indicator
The TSI is a lagging indicator, which means that it is based on past price data and may not be very effective in predicting future price movements. Traders should be aware that the TSI may not be as accurate in predicting sudden or unexpected changes in market conditions.
2. False Signals
Like all technical indicators, the TSI is not infallible and can produce false signals. Traders should be cautious when relying solely on the TSI to make trading decisions and should consider using it in conjunction with other indicators and analysis techniques.
3. Sensitivity to Smoothing Periods
The TSI is sensitive to the smoothing periods used in its calculation. Different smoothing periods can produce different results, and traders should be aware of this when interpreting the TSI. It is important to find the right balance between sensitivity and reliability when selecting the smoothing periods.
4. Limited Use in Trendless Markets
The TSI is designed to identify trends in the market, and may not be very effective in trendless or sideways markets. Traders should be aware that the TSI may produce false signals or provide limited information in these types of market conditions.
In summary, while the TSI can be a useful tool in technical analysis, traders should be aware of its limitations and use it in conjunction with other indicators and analysis techniques.
Conclusion
In conclusion, the True Strength Index (TSI) is a powerful technical indicator that can help traders identify trends and potential buy/sell signals. By using the TSI in conjunction with other technical analysis tools, traders can gain a better understanding of market conditions and make more informed trading decisions.
One of the key advantages of the TSI is that it is a momentum indicator that takes into account both price and volume data. This can provide a more accurate picture of market trends and help traders identify potential reversals or breakouts.
When using the TSI, it is important to consider the time frame being analyzed. Shorter time frames may produce more frequent signals, but may also be more prone to false signals. Longer time frames may produce more reliable signals, but may also require more patience and discipline.
Overall, the TSI is a valuable tool for traders looking to gain an edge in the markets. By incorporating the TSI into their trading strategies, traders can improve their chances of success and achieve more consistent profits over time.