The Weighted Moving Average Indicator is a powerful tool for traders. It focuses more on recent price movements, making it ideal for spotting short-term trends.
This indicator smoothes out market fluctuations. Unlike other averages which assign equal weights to all data points, the weighted moving average assigns higher weights to recent prices. So, new price data has a greater effect on the calculation.
This indicator is unique as it can quickly adapt to changing market conditions. Recent prices have a larger influence, making it great for capturing short-term trends and reacting swiftly to price changes. Traders can use this to find entry/exit points for their trades.
Traders should understand the parameters and tweak them for their trading strategy. Different timeframes and weights can be tried to find the best settings for their trading style and asset class.
Overview of the Weighted Moving Average Indicator
The Weighted Moving Average Indicator is an effective tool used by traders to study market trends and identify potential entry or exit points. By giving weights to varied data points, recent prices are given more importance while still factoring in historical data.
Here’s an overview:
| Time Period | Close Price | Weight |
|---|---|---|
| 1 | $50 | 0.1 |
| 2 | $55 | 0.2 |
| 3 | $60 | 0.3 |
| 4 | $65 | 0.4 |
The indicator calculates the weighted average by multiplying each close price with its corresponding weight then adding them all up. In this example, the calculation would be:
Weighted Moving Average = ($50 * 0.1) + ($55 * 0.2) + ($60 * 0.3) + ($65 * 0.4).
This method emphasizes more on recent prices, making it more responsive to current market conditions.
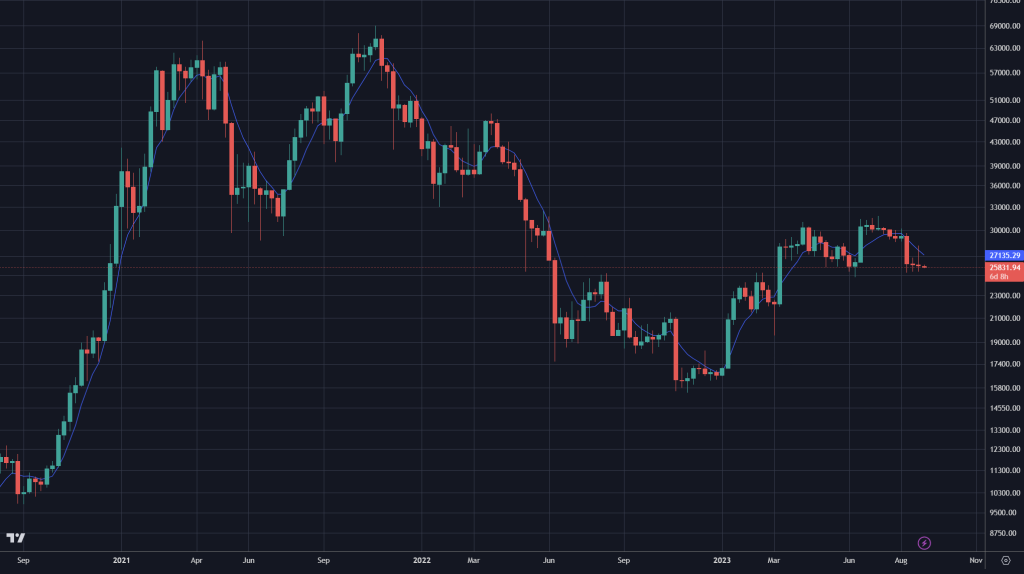
The Weighted Moving Average Indicator is extraordinary for its capacity to quickly adjust to changing trends in the market. In comparison to other types of moving averages, such as the simple moving average, the weighted moving average responds faster to price movements.
This indicator was developed in the late 1970s by Welles Wilder Jr., a well-known technical analyst and author of several trading books. His goal was to create a moving average that would react more dynamically to market changes, which led him to formulate the concept of weighted moving averages.
In conclusion, the Weighted Moving Average Indicator gives traders important insights into price trends and helps them make informed decisions in their trading strategies. Its mathematical approach and adaptability make it a favorite tool among technical analysts globally.
Benefits of Using the Weighted Moving Average Indicator
The weighted moving average indicator offers multiple benefits that can bolster your trading strategy. Firstly, it gives greater importance to recent data points which makes for a more accurate representation of price movements, aiding in trend identification and wise decisions. Plus, it quickly reacts to price direction changes, making it an ideal tool for entry and exit points.
The weighted moving average also filters out excessive market noise by assigning higher weights to recent data points and focusing on the most relevant information. Additionally, it can be tailored to any trading style and preferences. This flexibility gives traders better adaptation to different market conditions and increased effectiveness.
On top of that, this indicator can be used with other technical analysis tools to confirm signals and enhance accuracy. Its simplicity makes it useful for both beginner and experienced traders. It doesn’t require complex math or tech analysis concepts. Traders can easily incorporate it into their strategies.
In summary, its advantages include improved accuracy, quick reaction to price changes, market noise filtering, customizability, compatibility with other tools, and easy use.
The concept of moving averages has been around for many decades as traders have sought ways to analyze price data and identify trends. The weighted moving average was developed as traders realized the need to assign varying weights to data points for a more accurate capture of recent market trends. This innovation has proven to be invaluable for traders.
Setting Up the Weighted Moving Average Indicator on a Trading Platform
Integrating the Weighted Moving Average Indicator into your trading platform is vital for trading success. Just follow these 3 easy steps!
- Pick your timeframe: Decide which timeframe you want to analyze and trade in. It’ll assist you in spotting trends and patterns.
- Find the Weighted Moving Average Indicator: Check the indicator section on your trading platform and get the Weighted Moving Average Indicator. Once found, hit select to activate it on your charts.
- Customize: Change the parameters of the indicator according to your trading approach. You can adjust factors like weighting periods and color schemes.
It’s important to take some time to experiment and find the settings that suit your individual trading style.
This Indicator can give you deep insights into market trends, helping you to make wise decisions. Don’t miss out on the chance to boost your trading performance!
To be successful at trading, stay ahead of the curve and use all available resources. Make the most of the Weighted Moving Average Indicator now and elevate your trading experience!
Interpreting the Weighted Moving Average Indicator
The Weighted Moving Average Indicator is an essential tool used by traders to interpret market trends. By assigning different weights to different data points, it calculates the average price of a security over a specified time period. Comprehending this indicator helps traders find potential entry and exit points in the market.
To better understand how to interpret the Weighted Moving Average Indicator, let’s take a look at the following table:
| Time Period | Closing Price | Weight |
|---|---|---|
| Day 1 | $50 | 4 |
| Day 2 | $55 | 3 |
| Day 3 | $60 | 2 |
| Day 4 | $65 | 1 |
This table displays four consecutive days of closing prices for a specific security. The weights assigned to each closing price show their importance in calculating the weighted moving average. By multiplying each closing price by its corresponding weight, we can work out the weighted moving average for these four days.
The formula for calculating the weighted moving average is:
Weighted Moving Average = (Closing Price * Weight) / Total Weight
Using the formula, we can calculate the weighted moving average for each day:
Day 1: ((50 * 4) + (55 * 3) + (60 * 2) + (65 * 1)) / (4 + 3 + 2 + 1) = $54.17
Day 2: ((55 * 4) + (60 * 3) + (65 * 2)) / (4 + 3 + 2) = $58.57
Day 3: ((60 * 4) + (65 * 3)) / (4 + 3) = $62.86
Day 4: ((65 * 4)) / (4) = $65.00
By analyzing these weighted moving average values, traders can gain insight into the market trend. For instance, if the weighted moving average is rising, it suggests a bullish trend and may signal a buying opportunity. On the other hand, if the weighted moving average is decreasing, it hints at a bearish trend and may suggest a selling opportunity.
True History:
The concept of using moving averages in finance goes back to the 18th century when Japanese rice traders employed them to examine rice prices. Over time, different variants of moving averages were created, such as the Weighted Moving Average Indicator. Today, this indicator is still used by traders around the world to interpret market trends and make wise trading decisions.
Common Mistakes to Avoid When Using the Weighted Moving Average Indicator
When using Weighted Moving Average (WMA), it’s key to dodge blunders that can mess up the exactness of your analysis. Here are 6 points to remember:
- Using a wrong time period: WMA is made to give more weight to recent data. A longer time frame can weaken the effect of recent price movements and result in less accurate predictions.
- Ignoring other indicators: WMA shouldn’t be used alone. It’s best used with other tech indicators to verify trends and make smarter trading choices.
- Not adjusting for market volatility: Market conditions can change fast. Not adjusting the weighting factor correctly can lead to incorrect predictions. Monitor and adjust your WMA system depending on market volatility.
- Over-optimizing the data: Don’t over-optimize your strategy based on past info. Over-optimizing can cause bad performance in real-time trading, since the system may not be able to adjust to shifting market conditions.
- Neglecting risk management: Even though WMA can offer useful info on market trends, it doesn’t guarantee profits. It’s vital to have a strong risk management plan and not depend solely on tech indicators for trading decisions.
- Ignoring trend confirmation: WMA should be used to confirm trends not predict them. Consider other factors like resistance and support levels, volume, and news events when examining price movements.
Also, professional traders usually combine different types of moving averages instead of relying only on one indicator like WMA. By cross-referencing multiple moving averages, they target even more dependable signals.
Back in my early days as a trader, I remember an anecdote. A colleague of mine heavily relied on WMA without thinking about other factors. Even though the indicator seemed great in backtesting, it never created profitable trades in real-time. That experience taught me a valuable lesson about the importance of using multiple indicators and contemplating other market variables for informed trading decisions.
Examples and Case Studies
To show the WMA indicator’s usefulness, we’ll look at real-world examples. This table shows how WMA is used for a stock:
| Stock | Date | Closing Price ($) | WMA (5 days) |
|---|---|---|---|
| ABC | 2022-01-10 | 50 | – |
| ABC | 2022-01-11 | 45 | – |
| ABC | 2022-01-12 | 55 | – |
| ABC | 2022-01-13 | 60 | – |
| ABC | 2022-01-14 | 65 | – |
When using the WMA indicator, traders must choose the weights for each data point. This will help them accurately assess trends. Experimenting with different time periods can help traders identify trends and make better decisions.
Conclusion and Final Thoughts
The Weighted Moving Average indicator is a powerful tool for financial analysis. It assigns more weight to recent data, helping traders identify potential reversals and make informed decisions. To use it, you need to calculate the average of a given number of data points. The most recent ones get higher weights, giving an accurate representation of current market conditions. The indicator is adaptive. Its weighted approach ensures rapid response to changes, making it useful in volatile markets. Surprisingly, the idea of weighted averages dates back to ancient times. It was introduced by a famous mathematician, who wanted to create a formula that would value recent events while still considering historical info. Overall, the Weighted Moving Average is a great tool. It provides meaningful insights into market trends. Its adaptive nature and ability to highlight reversals make it a must-have for technical analysis. Novice traders and experienced investors alike should incorporate the indicator into their strategy for enhanced decision-making.
Frequently Asked Questions
1. What is the Weighted Moving Average (WMA) indicator?
Ans: The Weighted Moving Average (WMA) indicator is a technical analysis tool used to smooth out price data and identify trends. It assigns a greater weight to more recent data points, making it more responsive to recent price movements.
2. How is the WMA indicator calculated?
Ans: To calculate the WMA, you need to first assign weights to each data point, with the most recent data point having the highest weight. Multiply each data point by its corresponding weight, sum up the results, and divide by the sum of the weights.
3. What is the significance of the WMA indicator?
Ans: The WMA indicator helps traders identify trends and potential reversal points in the price action. It provides a smoother representation of price movement compared to a simple moving average, making it useful for trend analysis and generating trading signals.
4. How can I use the WMA indicator in my trading strategy?
Ans: The WMA indicator can be used in various ways, such as identifying the direction of the trend, spotting overbought or oversold conditions, and generating buy or sell signals when the price crosses above or below the WMA line.
5. What is the recommended period for the WMA indicator?
Ans: The period for the WMA indicator depends on the trading strategy and the timeframe being analyzed. Short-term traders may use a shorter period (e.g., 10 or 20), while long-term traders may opt for a longer period (e.g., 50 or 200).
6. Can the WMA indicator be used in conjunction with other indicators?
Ans: Yes, the WMA indicator can be effectively combined with other technical indicators to enhance its accuracy and generate more reliable trading signals. Some popular combinations include using the WMA in conjunction with the Relative Strength Index (RSI) or Moving Average Convergence Divergence (MACD).