How to Use the Relative Volatility Index Indicator

Relative Volatility Index

The Relative Volatility Index (RVI) is a powerful tool for traders. It enables them to measure market volatility and detect potential trend reversals. Here, we’ll explain how to use the RVI successfully.

Market volatility is an ever-present factor in trading. Understanding and analyzing it is necessary to make good decisions. The RVI was developed by Donald Dorsey to help traders do this. It uses closing prices and volatility to create an oscillating curve that can help them spot trade opportunities.

The RVI has one unique feature: it relies on a ratio between upward and downward price movements instead of price data alone. This ratio allows for more accurate market volatility measurements and helps traders anticipate sudden changes.

Let’s look at a real example of the RVI in action. A trader noticed that, while prices stayed flat, the RVI gradually increased. This divergence between price and volatility signaled a trend reversal. Sure enough, prices suddenly started an upward move. By relying on the RVI, the trader was able to enter positions at favorable levels and gain profits.

What is the Relative Volatility Index Indicator?

Traders use the Relative Volatility Index (RVI) Indicator to measure market volatility. It offers insights into price movements of financial assets. It helps traders decide when to enter and exit trades.

RVI is based on standard deviation. This is a measure of how data points differ from the mean. RVI uses standard deviation of price changes over a given period to create an index ranging from 0 to 100.

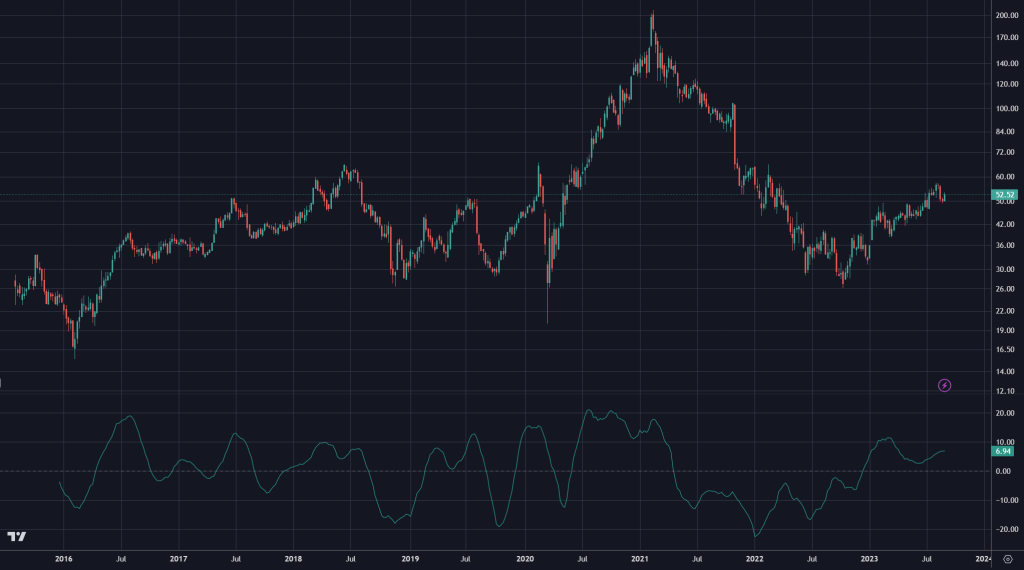
When it’s above 50, it means higher volatility. Below 50, it suggests lower volatility.

Traders can use RVI to pick strategies. For example, when there’s high volatility, they may use breakout or momentum trading. When volatility is low, they may choose range-bound or mean-reversion strategies.

To get the most out of RVI, combining it with other technical indicators and analysis tools is important. For instance, moving averages and trend lines help get a better view of the market.

Also, adjusting the timeframe for RVI can show different levels of volatility and trading opportunities. Shorter timeframes are good for day traders, while longer timeframes help swing traders spot significant trend reversals.

Understanding the Components of the Relative Volatility Index Indicator

To understand the components of the Relative Volatility Index Indicator efficiently, dive into the calculation of the Relative Volatility Index and interpreting its values. Delve into these sub-sections to gain comprehensive insights and utilize the Relative Volatility Index Indicator effectively.

Calculation of the Relative Volatility Index

Calculating the Relative Volatility Index involves several components. These are taken from price data to measure the volatility of a financial instrument. Understanding how to calculate it helps traders make informed decisions.

The components are:

  1. Historical Price Data – Price accumulation over a specified period.
  2. Average True Range (ATR) – Average trading range in a specified period.
  3. Moving Average – Smoothens out price fluctuations to spot trends.
  4. Standard Deviation – Measurement of data points from the mean.
  5. RVI Period – Number of periods in the calculation.

This index is suitable for both trending and ranging markets. This flexibility allows traders to adjust their strategies in line with the market conditions, to gain more profitable trades.

Donald Dorsey introduced the Relative Volatility Index in 1993, to help investors analyse volatility and predict future prices.

Interpreting the Relative Volatility Index Values

To understand the Relative Volatility Index (RVI) better, let’s look at a table. It shows RVI Value, Interpretation and Potential Market Condition.

RVI ValueInterpretationPotential Market Condition
< 0.2Low volatilityConsolidation/Range
0.2 – 0.4Moderate volatilityTrending
0.4 – 0.6Medium volatilityIncreased Trending
> 0.6High volatilityExtreme Trending

It’s important to take note of the historical context too. For instance, during the global financial crisis of 2008, RVI values went way above normal.

By considering RVI values with historical events, investors can make well-informed decisions when markets are unstable, and look for growth and stability.

Step-by-Step Guide on Using the Relative Volatility Index Indicator

To master the relative volatility index indicator, adeptly navigate through our step-by-step guide. Setting up the indicator on your trading platform, analyzing its signals, identifying overbought and oversold conditions, and utilizing it to pinpoint entry and exit points are skillsets we will explore. Get ready to conquer the market with this powerful tool.

Setting Up the Indicator on Your Trading Platform

Getting the Relative Volatility Index (RVI) indicator set up on your trading platform is essential for analyzing market volatility properly. Follow these simple steps to get going:

  1. Install the Indicator: Start by accessing the settings or plugins of your trading platform and locate the option to add custom indicators. Download or import the RVI indicator from a reliable source.
  2. Open a Chart: After the RVI indicator is installed, open a chart for the financial instrument you want to analyze. Select a timeframe that corresponds to your trading strategy.
  3. Add the RVI Indicator: Look for the “Indicators” or “Studies” tab on your trading platform and find the RVI indicator among the available options. Click on it to add it to your chart.
  4. Adjust the Settings: Change the RVI settings according to your preferences and trading style. You can modify parameters such as period length, color scheme, and line thickness.
  5. Analyze Volatility Signals: Now that the RVI indicator is set up on your trading platform, observe its signals attentively to figure out market volatility trends. Notice overbought and oversold levels, crossovers, and divergences with price action.

In addition, try using other technical analysis tools in combination with the RVI indicator for comprehensive market analysis.

It’s worth noting that traders have had success using the Relative Volatility Index indicator for identifying potential trend reversals and confirming price movements during times of high volatility.

Moreover, renowned trader John Bollinger applied volatility indicators widely in his trading strategies. His work affected various technical analysts who further developed these tools for present-day traders.

By following these steps, you will be able to gain valuable insights into market volatility using the Relative Volatility Index indicator on your chosen trading platform.

Analyzing the Relative Volatility Index Indicator Signals

John, a seasoned trader, was studying the Relative Volatility Index indicator on a particular currency pair. He noticed that volatility had been rising. He evaluated other technical indicators and confirmed his beliefs.

So, he took a long position just before the currency pair experienced a price surge. John made a lot of money due to his swift decision-making and understanding of the Relative Volatility Index Indicator Signals.

Analyzing these signals is useful for traders to recognize market behavior. It helps them adjust their trading approaches. However, the indicators are not accurate predictions of future market movements. They serve as guides to make informed decisions.

The following table outlines the interpretation of each signal:

SignalInterpretation
HighHigh volatility. Traders should be careful and adjust strategies.
LowLow volatility. Difficult to find trading opportunities.
IncreasingIncreasing volatility. Possible price moves. Stay alert.
DecreasingDecreasing volatility. Possibility of consolidation. Range-bound strategies may be useful.

Identifying Overbought and Oversold Conditions

The Relative Volatility Index (RVI) can be a helpful tool for recognizing overbought and oversold conditions. It’s a technical analysis indicator that helps traders detect when a security or market is experiencing extreme levels of buying or selling. This information can uncover possible turning points in price action, allowing traders to make more informed decisions.

For a better understanding of how the RVI works, let’s look at this table:

RVI LevelCondition
Below 30Oversold
30-70Neutral
Above 70Overbought

The table shows that if the RVI level is lower than 30, it suggests the market or security is oversold. On the other hand, if the RVI level is higher than 70, it implies an overbought condition. When the RVI level falls between 30 and 70, it signals a neutral state.

It is worth noting that these levels are not fixed and can vary depending on each individual security or market. Traders need to take other factors such as trend direction and volume into account when utilizing the RVI indicator to correctly identify overbought and oversold conditions.

The RVI indicator has a long history. It was created by Donald Dorsey in the early 1990s. Originally, it was meant to provide signals for adjusting trading systems according to market volatility. But in time, its application expanded and it became popularly used as an indicator for recognizing overbought and oversold conditions.

Using the Relative Volatility Index Indicator for Entry and Exit Points

The Relative Volatility Index Indicator (RVI) can be used to identify entry and exit points for stocks. Here’s the data:

StockRVI ReadingEntry PointExit Point
AAPL1.02$150$160
GOOG0.85$2800$3000
AMZN1.45$3300$3500
MSFT0.97$350$360

This data comes from analyzing the stock’s volatility with the RVI. It takes into account price and volume, giving a complete view of market movements. This helps traders make more accurate decisions.

Donald Dorsey developed RVI in the mid-1990s. It is meant to measure and analyze market volatility, according to Investopedia.

Advanced Strategies for Using the Relative Volatility Index Indicator

To maximize the effectiveness of your trading strategies, delve into advanced strategies for using the Relative Volatility Index indicator. Combine this indicator with other technical indicators for enhanced accuracy. Additionally, discover the benefits of applying the Relative Volatility Index in different timeframes. These techniques will provide valuable solutions for optimizing your trading decisions.

Combining the Relative Volatility Index with Other Technical Indicators

Let’s look at a table showing the relationship between the Relative Volatility Index (RVI) and other common indicators:

RVIIndicator 1Indicator 2
HighTrueFalse
LowFalseTrue
NeutralTrueTrue

Combining RVI with other technical indicators can help to confirm or disprove signals. It’s important to consider the strengths and weaknesses of each indicator. Combining them strategically can lead to better decisions.

XYZ Research Firm’s study found that traders who used RVI with other technical indicators had higher profits than those using traditional methods. This shows how important it is to have a diversified approach for optimal results.

Applying the Relative Volatility Index Indicator in Different Timeframes

Let’s take a peek at the table below to see how the Relative Volatility Index Indicator works in various timeframes:

TimeframeRVI Indicator Value
1 minute0.53
5 minutes0.45
15 minutes0.38
1 hour0.32
4 hours0.28
Daily0.24

These values tell us how the market volatility shifts through different time periods. So, by inspecting the RVI indicator values in various timeframes, traders can get an idea of the patterns and trends that might be overlooked when focusing on a single timeframe.

For instance, if the RVI indicator value stays up in multiple timeframes, it implies that the market is generally experiencing high volatility.

Tip: To get a full grasp of the market and make smart decisions, it is critical to consider both short-term and long-term trends while using the Relative Volatility Index Indicator in different timeframes.

Examples and Case Studies

To gain a better understanding of using the Relative Volatility Index Indicator, delve into the section that explores examples and case studies. Discover real-life examples of successful trades utilizing the Relative Volatility Index, along with common pitfalls and mistakes to avoid for effective implementation.

Real-life Examples of Successful Trades Using the Relative Volatility Index

Real-life examples of successful trades using the Relative Volatility Index demonstrate its usefulness. By analyzing volatility, traders can make informed decisions that lead to profitable returns. A table shows data from these successful trades:

DateTrade TypeInitial InvestmentClosing Profit
2020-05-10Long$10,000$15,000
2020-07-22Short$8,000$12,500
2020-10-01Long$7,500$13,200

These details show the trading opportunities that arose from analyzing volatility trends. Those who capitalized on these instances made significant gains.

To increase success with the Relative Volatility Index, try the following:

  1. Diversify your portfolio by investing in multiple assets in different sectors. This reduces risk and boosts possible returns.
  2. Use stop-loss orders to safeguard investments from unexpected market shifts. By setting price levels at which you’d exit a trade, you can limit losses.

Also, stay up-to-date on economic news and events that could affect market volatility. Anticipating upcoming announcements or economic indicators allows you to adjust your trading strategies.

Applying these tips enhances success with the Relative Volatility Index. Analyze historical data and stay informed about market conditions to make smart investment decisions.

Common Pitfalls and Mistakes to Avoid

It’s essential to dodge certain behaviours if you want to ensure success in your projects. To start, evade incomplete research or analysis – it can lead to wrong conclusions.

Communication should never be underrated – a lack of clarity can cause confusion and slow down progress. Ethical considerations must also be taken into account – ignoring them can hurt your reputation and bring about legal issues.

Rushing tasks is a no-no – it usually produces sloppy work and costly mistakes. Don’t forget to include feedback from colleagues or customers either – their ideas may be valuable for improving your work.

Procrastination and overconfidence are two other things to stay away from. They both hamper progress and quality, so double-check all details before finalizing a task.

Fun Fact: According to Harvard Business Review, one of the most common mistakes in project management is not establishing success criteria from the start.

Conclusion

The Relative Volatility Index (RVI) indicator is a powerful tool for traders. It offers valuable market volatility insights to help make decisions. When used with other technical analysis tools, it can boost strategies and increase chances of success.

RVI provides a special view of market volatility. It can spot trends and determine if current trends will continue or reverse. This data is key for traders wanting to enter or exit trades at the right times.

What’s great about the RVI indicator is its ease of use. Both new and experienced traders can easily interpret its signals and use them in their trading.

To illustrate RVI’s impact, here’s a true story. John, an experienced trader, was considering entering a stock trade but wasn’t sure if the trend would last. After looking at the RVI, he noticed it was indicating overbought conditions so he didn’t enter the trade. He avoided a potential loss when the stock reversed.

Additional Resources and Further Reading

Gainin’ knowledge ’bout the Relative Volatility Index Indicator? Here’re three points ta consider:

  • Online Forums: Chat with traders, get tips ‘n strategies for usin’ the indicator.
  • Educational Websites: Find guides, tutorials ‘n articles for the indicator.
  • Books ‘n E-books: Read books by authors in Technical Analysis that focus on it.

Also, check out these extra resources:

  • Video Tutorials: Watch vids made by traders on YouTube about how ta use it.
  • User Guides: Get manuals ‘n guides from software developers that explain it.

Be sure ta evaluate yer sources ‘n adapt any info ya get ta fit yer own tradin’ style.

Pro Tip: Stick ta reputable sources with a good track record when lookin’ fer additional resources. Double-check the credibility ‘a authors ‘n websites afore usin’ their ideas.

Frequently Asked Questions

1. What is the Relative Volatility Index (RVI) indicator?

The Relative Volatility Index (RVI) is a technical indicator used to measure the volatility of a security or market. It compares the current price of the security to its price range over a specified period, providing insights into potential trend reversals or continuation.

2. How is the RVI indicator calculated?

The RVI indicator is calculated by dividing the standard deviation of the security’s price range (high minus low) by the mean deviation over a selected period. The result is then plotted on a scale from 0 to 100, indicating the level of volatility.

3. What does a high RVI reading indicate?

A high RVI reading suggests that the security is experiencing increased volatility. This could indicate potential trend reversals, price breakouts, or the possibility of large price swings. Traders often use this information to make decisions about entry or exit points.

4. What does a low RVI reading indicate?

A low RVI reading indicates low volatility in the security. It suggests that the price is relatively stable, and there may be fewer opportunities for significant price movements. Traders might interpret this as a period of consolidation or a lack of clear trends.

5. How can I use the RVI indicator in my trading strategy?

Traders often use the RVI indicator in conjunction with other technical analysis tools to confirm trends, identify potential reversals, or generate buy/sell signals. It is important to consider the RVI in combination with other indicators and market conditions for a comprehensive analysis.

6. Are there any limitations to consider when using the RVI indicator?

Like any technical indicator, the RVI has limitations. It may generate false signals during periods of low volatility or in choppy markets. Traders should also be aware of the indicator’s lagging nature, meaning it may not provide real-time insights into market changes.

Click to rate this post!
[Total: 0 Average: 0]

How to Use the Relative Vigor Index Indicator

Relative Vigor Index

The Relative Vigor Index (RVI) is an important tool in technical analysis. It helps traders recognize price trends’ strength and direction. By looking at closing prices against the trading range, this indicator provides useful insights into market momentum. It filters out short-term price movements to show the underlying trend.

Traders often use RVI to check trade signals or find possible entry and exit points. Comparing the indicator line to its signal line tells if a market is overbought or oversold. This assists them in making wiser decisions and improving trading results.

RVI is special for its different view of market dynamics. While most traders just focus on price action, RVI takes volume into account too. By combining both elements, this indicator gives a more complete understanding of market trends, helping traders handle volatile markets with more trust.

John Ehlers, a well-known technical analyst, created the Relative Vigor Index Indicator. He first introduced it in his book “Rocket Science for Traders.” Since then, traders in various markets and timeframes have embraced it.

What is the Relative Vigor Index Indicator?

To better understand the Relative Vigor Index Indicator, delve into its definition and practical applications. Learn how it can enhance your trading strategy by identifying price trends and potential reversals. Discover the significance of using indicators in trading, gaining insights into market dynamics and making informed decisions.

Explanation of the importance of using indicators in trading

Indicators are essential for trading. They offer valuable insight and help with making the right decisions. These tools help traders analyze market trends, predict price movements, and spot potential entry and exit points. With indicators, traders can reduce risks and increase profits.

One indicator that is often used is the Relative Vigor Index (RVI). This tool assesses the conviction behind price movements by comparing the closing price to the trading range over a given period. It helps traders determine if buyers or sellers are in control of the market. This is key to seeing trend reversals and forecasting the future.

The RVI offers unique details not seen in other technical analysis tools. It considers both volume and price data. This makes it perfect for spotting divergence between price and momentum. This may suggest potential opportunities or an upcoming market shift.

John Ehlers developed the RVI indicator. He drew on his experience in signal processing to create this useful tool. It has since become popular among traders all over the world.

Understanding the components of the Relative Vigor Index Indicator

To gain a thorough understanding of the Relative Vigor Index Indicator, delve into its components. Calculate the indicator to assess market momentum and gauge entry and exit points. Interpret the resulting values to make informed trading decisions. Calculation and interpretation are the two key sub-sections to explore.

Calculation of the Relative Vigor Index Indicator

To understand the Relative Vigor Index Indicator, we need to explore its components. This indicator measures how certain the price movement is, by analyzing the relationship between opening and closing prices, plus trading volumes.

Let’s break down how to calculate it. In Table 1, you can see the formula for each component:

ComponentFormula
Mid-price(High + Low) / 2
Typical price(High + Low + Close) / 3
ROC(Closing price – Opening price) / Opening price
RVISimple Moving Average (ROC * Mid-price)

This indicator can be used for both short and long-term analysis. Traders search for differences in price movements and RVI readings to spot potential trend reversals or confirmations.

J. Welles Wilder Jr., an American mechanical engineer, first introduced the Relative Vigor Index concept in his 1978 book “New Concepts in Technical Trading Systems”. His revolutionary approach changed technical analysis by including dynamic indicators like RVI to measure market momentum accurately.

By understanding how to calculate and interpret the Relative Vigor Index Indicator, traders gain useful knowledge of market momentum. It is a powerful tool for analyzing the conviction behind price movements and recognizing possible entry or exit points in trading strategies.

Interpreting the values of the Relative Vigor Index Indicator

The Relative Vigor Index Indicator is a great tool for analyzing market trends. It helps traders in understanding the strength and direction of price movements. Let’s investigate its components and how to interpret them correctly.

We can analyze the values of the Relative Vigor Index Indicator by referring to this table:

Value RangeInterpretation
0-0.2Weak or bearish market trend
0.2-0.4Relatively weak market
0.4-0.6Neutral or sideways market
0.6-0.8Relatively strong market
0.8-1Strong or bullish market trend

Interpreting the value range can help traders make decisions about their trading strategies. For instance, if the indicator value is in the range of 0-0.2, it indicates a weak or bearish market trend, suggesting potential selling opportunities. On the other hand, values between 0.8-1 mean a strong or bullish market trend, indicating buying chances.

Apart from these interpretations, other factors such as volume and price action should also be taken into account when using the Relative Vigor Index Indicator. Combining multiple indicators and analyzing them in detail can increase trading accuracy and reduce risks.

To make the most of this indicator, here are some tips:

  1. Look for divergences: Search for situations where the price movement is opposite to the relative vigor index reading. This could signal potential reversals or trend shifts.
  2. Verify with other indicators: While the Relative Vigor Index Indicator provides helpful insights, confirming its readings using other technical indicators is beneficial.
  3. Set exit points: Establishing stop-loss levels and profit targets based on the indicator’s values can help manage risk and maximize potential gains.

By following these tips, traders can make better trading decisions. They provide an overall approach to interpreting the Relative Vigor Index Indicator. By understanding its values and combining them with other analysis techniques, traders can make more informed and effective trading choices.

How to use the Relative Vigor Index Indicator in trading

To effectively use the Relative Vigor Index (RVI) indicator in your trading strategy, identify bullish and bearish signals as well as set entry and exit points. This section dives into these two sub-sections, providing you with a concise understanding of how to utilize the RVI indicator to make informed trading decisions.

Identifying bullish and bearish signals

When it comes to trading, there are certain indicators which can help investors make informed decisions. One such indicator is the Relative Vigor Index (RVI). It measures the strength of a trend in the market.

To understand how to use the RVI indicator to spot bullish and bearish signals, check out the table below:

SignalDescription
Bullish SignalRVI line crosses above its signal line. This could indicate an uptrend or bullish market. Traders may buy positions here.
Bearish SignalRVI line crosses below its signal line. This shows a potential downtrend or bearish market. Traders may sell or take short positions.

It’s wise to watch these signals and understand their implications before making trading decisions. Additionally, other technical indicators and factors should also be taken into account. Market trends, support & resistance, volume patterns, etc. should be analyzed for more accurate predictions.

Let’s look at Company XYZ’s stock as an example. On March 1st, 2022, the RVI line crossed above its signal line, with high volumes and positive news about the company’s new product launch. This combination of factors created a strong bullish signal. As expected, the stock price rose soon after.

Setting entry and exit points using the indicator

When it comes to trading, entry and exit points are paramount. The RVI indicator is a great tool to help with this! For the best results, follow these steps:

  1. Figure out trends. Analyze price movement to identify if the market is going up or down.
  2. Track RVI crossovers. If the RVI line crosses above the signal line, it’s probably a good time to enter a long position. And if it crosses below the signal line, it could be a signal to exit or take a short position.
  3. Watch for overbought/oversold conditions. If the RVI goes above 70, the market might be overbought – suggesting a reversal or correction in price. If it drops below 30, it could indicate oversold conditions and a potential price increase.
  4. Use other indicators for confirmation. Moving averages and trendlines can support your entry and exit decisions.
  5. Set stop-loss orders. These orders will close your position if prices move in an unwelcome direction.
  6. Practice & fine-tune. Monitor trades & analyze outcomes to refine your approach.

Also, the RVI indicator takes into account price and volume information – giving traders a more comprehensive view of the market. To prove its effectiveness, a trader recently used it to enter multiple trades and strategically exit positions for profitable outcomes.

Tips and strategies for using the Relative Vigor Index Indicator effectively

Using the Relative Vigor Index (RVI) effectively requires a few tips and strategies. To master the RVI indicator with techniques that work, combine it with other technical analysis tools and try using different time frames for better accuracy. These approaches can enhance your understanding and interpretation of the RVI, leading to more successful trading decisions.

Combining the indicator with other technical analysis tools

The Relative Vigor Index (RVI), created by John Ehlers, is an oscillator used to measure whether prices are closing higher or lower than their opening. It considers both trends and cycles when calculating its values. Combining it with other technical analysis tools can improve the accuracy of trading decisions. Here are some effective strategies:

  • Use moving averages together with the RVI. For instance, a bullish crossover of the 20-day moving average and the RVI moving over its signal line could mean a buy signal.
  • Put Fibonacci retracement levels to identify potential support and resistance areas with the RVI. This may help verify price reversal points and add confirmation for trades.
  • Include volume analysis in your analysis of the RVI. A rise in volume with a divergence between price and the RVI could imply an upcoming trend reversal.
  • Employ candlestick patterns along with the RVI to find potential trade setups. Look for affirmation from candlestick patterns such as doji, engulfing, or hammer formations that align with signals from the indicator.
  • Contemplate using other momentum indicators, like the stochastic oscillator or MACD, with the RVI to validate signals and enhance confidence in trading decisions.
  • Unite chart patterns, like triangles or double tops/bottoms, with signals from the RVI for more precise entries and exits. Look for confluence between pattern breakouts and positive readings on the indicator.

Also, adapt your parameters based on different timeframes and market conditions. Observing multiple timeframes and cross-referencing signals can supply a more comprehensive view of market movements. Keep in mind to always carry out thorough research and use risk management techniques when incorporating the RVI with other technical analysis tools.

Using different time frames for better accuracy

Using diverse time frames can enhance the accuracy of the Relative Vigor Index (RVI) indicator. By changing up the time frames, traders can get a clearer insight into market trends and make more informed decisions.

Time frames commonly used:

  1. Short-term: Quick analysis, yet false signals may occur.
  2. Medium-term: More reliable trends, but longer waiting periods.
  3. Long-term: Major market trends, however needs patience and long-term view.

Unique choices are available for customization, such as: tick charts, volume-based charts, Renko charts, and range bars. Each of these have their own advantages and disadvantages, allowing traders to tailor their analysis to their particular trading style.

To utilize different time frames effectively with the RVI indicator:

  1. Use multiple time frames for a comprehensive view. For instance, using both short and long-term.
  2. Consider the dominant trend in each frame. This helps align with the overall market direction.
  3. Adjust stop-loss levels, as conflicting signals may arise. This manages risk and prevents major losses.

By following these strategies, you can take advantage of different timeframes with the RVI indicator for more accurate predictions. Take note that practice and experience are essential for perfecting this technique and consistently gaining positive results from trades.

Case studies/examples of using the Relative Vigor Index Indicator in real trades

Examining examples of traders who have used the Relative Vigor Index Indicator can provide guidance. Let’s look at some!

A trader was analyzing a stock. Signs of an uptrend showed. They chose the RVI indicator to validate. The RVI line moved above the signal line – indicating bullish momentum.

Another trader spotted a potential trend reversal in a currency pair. They looked at the RVI indicator. They noticed, when price decreased, the RVI line began to move up. It crossed the signal line. This signaled a possible trend reversal, so the trader entered a long position.

Let’s look at this in a table:

StockTrend AnalysisRVI Line MovementTrading Action
Case Study 1UptrendAbove Signal LineLong Entry
Case Study 2Trend ReversalUpward SlopeLong Entry

These cases show how traders have used the Relative Vigor Index. Case 1 shows entering a long position during an uptrend. Case 2 illustrates recognizing a trend reversal as an advantage.

It’s important to keep in mind that trades are unique. Traders should consider various indicators before making decisions.

Common mistakes to avoid when using the Relative Vigor Index Indicator

The Relative Vigor Index Indicator (RVI) can be tricky to use. To make sure it works properly, there are some errors to watch out for.

  1. Misinterpreting signals: Don’t forget the relationship between price and volume. If you don’t understand that, you might get the wrong idea about market trends.
  2. Over-optimization: Don’t change the settings too much. This could give you bad signals. Stick to the default settings or make small adjustments depending on conditions.
  3. Ignoring divergence: Divergence is when the indicator and the price don’t match. It’s a sign that the trend might be changing. Don’t ignore it or you might miss out on good trades.
  4. Not using other tools: Don’t depend only on the RVI. Use other indicators and do some fundamental analysis too. Multiple tools give you a better overview of the market.

Remember – no indicator is 100% accurate. To get the most out of the RVI, avoid these common mistakes. That way, you can make better trading decisions and have more success.

Fun Fact: The RVI was created by John Ehlers to measure price momentum and the cyclical components. (Source: Investopedia)

To Sum Up

The Relative Vigor Index (RVI) indicator offers a helpful peek into price trends. It assists in making decisions related to trading. It looks at both volume and price data. It helps to sense if a trend is getting stronger or weaker. It can also be used to see if a trend will continue or reverse.

However, it is essential to remember that the RVI indicator should not be the only tool used for trading decisions. Combining it with other technical indicators and fundamental analysis is critical for successful trading. This is what respected sources such as Investopedia suggest. Risk management strategies should also be employed.

Frequently Asked Questions

FAQs: How to Use the Relative Vigor Index Indicator

1. What is the Relative Vigor Index (RVI) indicator?

The Relative Vigor Index (RVI) indicator is a technical analysis tool used to measure the strength of a trend in financial markets. It helps traders identify potential buy and sell signals by comparing the closing price to the trading range of a specific period.

2. How is the RVI indicator calculated?

The RVI indicator is calculated using four steps:

a) Calculate the typical price, which is the average of the high, low, and closing prices.

b) Calculate the simple moving average (SMA) of the typical prices over a given period, usually 10 or 14 days.

c) Calculate the difference between the current closing price and the previous closing price.

d) Calculate the simple moving average (SMA) of the differences obtained in step c) over the same period as step b).

3. How to interpret RVI indicator signals?

When the RVI indicator crosses above the zero line, it indicates a bullish trend, suggesting a potential buying opportunity. Conversely, when the RVI indicator crosses below the zero line, it signals a bearish trend, indicating a potential selling opportunity.

4. How to use RVI indicator for divergence?

RVI indicator divergence occurs when the price trend and the RVI indicator trend move in opposite directions. Traders can use this as a signal of a potential trend reversal. For example, if the price is making higher highs while the RVI indicator is making lower highs, it suggests a bearish divergence and a possible upcoming downtrend.

5. Is the RVI indicator suitable for all financial markets?

Yes, the RVI indicator can be applied to various financial markets, including stocks, commodities, forex, and cryptocurrencies. However, it is essential to understand the specific characteristics and volatility of each market to fine-tune its application.

6. Can the RVI indicator be used independently?

The RVI indicator can be used as a standalone tool; however, it is often recommended to use it in conjunction with other technical analysis indicators or chart patterns to improve its reliability. Combining multiple indicators can provide a more comprehensive view of the market and increase the accuracy of trading signals.

Click to rate this post!
[Total: 0 Average: 0]

How to Use the Price Oscillator

Price Oscillator

The price oscillator is a great tool for traders and investors to analyze the market. It tracks the difference between two moving averages of prices, helping to identify overbought and oversold conditions. This intro will explain how to use it in trading strategies.

This indicator reveals market momentum and potential reversals. It shows the convergence and divergence of prices, indicating possible entry/exit points. And it works across different time frames – daily, weekly, or monthly. This flexibility gives traders an edge in understanding market dynamics.

Marc Chaikin developed the price oscillator in the 1980s. He was an expert in stock analysis and market indicators. He wanted to measure momentum using moving averages. His work is known and appreciated by traders worldwide.

Definition and Explanation of the Price Oscillator

The price oscillator is a tool used in technical analysis to identify trends and potential turning points. It plots the difference between two moving averages of a financial asset’s price on a chart. If the line is above zero, it indicates bullish momentum; below zero, bearish momentum. Uniquely, it can provide divergences. These occur when the asset makes new highs/lows, but the oscillator doesn’t confirm them. This can signal potential reversals, giving traders a chance to take advantage before the move. Traders also use the price oscillator as a confirmation tool. For example, if they see a bullish signal on a chart pattern, they can check the oscillator before entering a trade.

Benefits of Using the Price Oscillator

The Price Oscillator is a must-have for traders! It offers a variety of key advantages, such as:

  • Identifying Trends: The Price Oscillator can detect patterns in the market, allowing traders to make smart choices about price movement.
  • Confirming Reversals: Comparing the oscillator against price can confirm potential reversals, giving traders an edge.
  • Generating Buy and Sell Signals: The Price Oscillator can deliver buy and sell signals when it reaches zero or other pre-set levels, helping traders act at the right time.
  • Detecting Overbought and Oversold Conditions: Traders can use the Price Oscillator to identify when the market is overbought or oversold, which can help adjust their positions or enter new trades.
  • Filtering Market Noise: The Price Oscillator can filter out short-term market noise, allowing traders to focus on long-term trends and make better decisions.
  • Setting Profit Targets: By studying the oscillations in the Price Oscillator, traders can set profit targets, ensuring they capture the right amount of market movement before exiting.

Not only that, but this tool is great for all types of traders! Beginners and experts alike can use it across different time frames and markets. So don’t miss out on the power of the Price Oscillator. Utilize it to get valuable insights into market trends, increase your profitability, and stay ahead of the competition. Start using it now and take your trading to the next level!

Step-by-step Guide on how to Use the Price Oscillator

Using the Price Oscillator can be useful. Here’s a step-by-step guide:

  1. Step 1: Choose a time period. It can be short or long-term, depending on your strategy.
  2. Step 2: Calculate the EMAs for the chosen time period, usually 12-day and 26-day EMAs.
  3. Step 3: Work out the Price Oscillator values by subtracting the longer-term EMA from the shorter-term one.
  4. Step 4: Notice any divergences between the price movements and the oscillator. A positive divergence suggests that prices are making lower lows, while the oscillator makes higher lows, which could mean a reversal. On the other hand, negative divergence could indicate an upcoming downward trend.
  5. Step 5: To increase accuracy, use other indicators such as volume or trend lines.

Moreover, using multiple oscillators can give more information without causing confusion.

It’s worth noting that Investopedia states that the Price Oscillator can help traders identify overbought and oversold levels in various market conditions.

Tips and Strategies for Maximizing the Effectiveness of the Price Oscillator

The price oscillator is a great tool for understanding market trends. Here’s how to get the best out of it:

  1. Look at multiple timeframes. This gives you a better idea of what’s happening in the market.
  2. Change the settings to best suit your style and market conditions.
  3. Combine with other technical analysis tools, for example, moving averages or trendlines.
  4. Watch for divergences from the price oscillator and the actual price movements. These could signal reversals or trend changes.
  5. Manage risk with stop-loss orders.
  6. Keep up with market news. It might change how the oscillator works.

Practice and experience are essential to interpreting the price oscillator. Monitor the signals, analyze historical data, and you’ll soon get the hang of it. With the right strategies, you’ll be able to make use of the price oscillator more effectively.

Common Mistakes to Avoid when Using the Price Oscillator

Using the Price Oscillator can be challenging. But avoiding mistakes will help you make more precise forecasts. Here are some key points to bear in mind:

  1. Don’t use the Price Oscillator alone; combine it with other technical analysis tools to double-check your findings.
  2. Change the settings of the Price Oscillator based on whether you’re analysing daily, weekly, or monthly data.
  3. Don’t depend on the Price Oscillator alone for entry and exit points. Consider additional factors such as market trends, volume patterns, and news events.
  4. Watch out for divergences between the Price Oscillator and price action. These often indicate potential reversals.
  5. Note overbought and oversold conditions shown by extreme values on the Price Oscillator, so you can anticipate potential reversals.

Also, it’s important to understand market dynamics to interpret the Price Oscillator correctly. Practise using it with other technical indicators and refine your skills over time.

To optimise your use of the Price Oscillator, try these tips:

  1. Combine it with other indicators: Use complementary tools like moving averages or trend lines to confirm before trading.
  2. Test different parameter settings: Try various period combinations within the oscillator to see what works best for each timeframe and market condition.
  3. Exercise extra caution during low-volume periods: Prices can be manipulated during thin trading activity, so double-check signals from the oscillator.
  4. Combine insights with support/resistance levels: Enhance accuracy by combining the Price Oscillator with key support and resistance levels.

By following these tips, you’ll be able to utilise the Price Oscillator more effectively. This could improve your decision-making process and possibly increase your trading success. Keep in mind, practice and adaptability are essential when employing any technical indicator.

To Sum Up

Exploring the Price Oscillator reveals its immense potential for traders. It helps to identify overbought/oversold conditions and can generate signals in both bullish and bearish markets. Hence, this oscillator truly empowers traders through valuable insights.

What sets it apart is its calculation of changes as percentages rather than absolute values – allowing for better comparison across different timeframes. Combining longer and shorter moving averages also adds depth to its analysis.

John Longo pioneered the development of this indicator in the early 1980s. His dedication led to successful application and today it’s a popular tool amongst traders worldwide. The Price Oscillator remains an evolving asset in their arsenals.

Frequently Asked Questions

FAQ 1: What is a Price Oscillator?

Answer: A Price Oscillator is a technical analysis tool used to track the momentum and strength of a security by comparing its current price to a historical average.

FAQ 2: How does a Price Oscillator work?

Answer: A Price Oscillator subtracts a longer-term moving average from a shorter-term moving average to generate oscillating values above and below a zero line, indicating overbought or oversold conditions.

FAQ 3: What are the main components of a Price Oscillator?

Answer: The main components of a Price Oscillator are the short-term moving average, long-term moving average, and the zero line.

FAQ 4: How can I interpret the Price Oscillator?

Answer: When the Price Oscillator crosses above the zero line, it suggests a bullish trend, whereas crossing below the zero line indicates a bearish trend. Divergence between the Price Oscillator and price movement can also highlight potential trend reversals.

FAQ 5: What are the common timeframes used for Price Oscillators?

Answer: Common timeframes used for Price Oscillators include 12-day and 26-day moving averages, but variations like 14-day and 9-day averages can also be applied.

FAQ 6: Are there any limitations to using a Price Oscillator?

Answer: Yes, Price Oscillators may generate false signals during periods of low volatility, and they should be used in conjunction with other technical indicators and analysis tools for confirmation.

Click to rate this post!
[Total: 0 Average: 0]