How to Use the Moving Average Ribbon Indicator

Moving Average Ribbon Indicator

The Moving Average Ribbon Indicator is a powerful tool. It helps traders make informed decisions. It shows different moving averages on one chart. This helps traders identify entry and exit points.

This indicator gives a comprehensive view of price action. Traders can observe how the moving averages interact with each other. This helps them identify trends and reversals.

The ribbon format shows multiple moving averages. This is better than looking at individual averages. It gives a visual representation of market sentiment.

If the ribbon shows shorter-term averages above longer-term ones, it suggests a bullish trend. If the ribbon crosses over or compresses, it may indicate a reversal.

Investopedia.com says this indicator is good for trending markets. It helps traders capture profits and avoid false signals. This indicator gives traders crucial insights. This helps them have more successful outcomes in financial markets.

What is the Moving Average Ribbon Indicator?

The Moving Average Ribbon Indicator is an awesome tool for technical analysis. It shows trends and support/resistance levels on a chart with multiple moving averages. Each average is the price over a given period, like 10 or 50 days.

Using it helps traders get an idea of the market’s movements and make better decisions. Plus, the ribbon’s display lets traders see how strong the trend is and where it might reverse. When tightly packed, the market is probably range-bound. When spread out, it suggests a strong trend.

This indicator stands out because it looks at multiple timeframes. This makes it more accurate and reliable than other indicators. Also, traders can customize it with their own values and colors. Short periods (10 or 20 days) give quicker signals for short-term trades. Longer periods (50 or 200 days) are better for long-term trades.

To get the most out of it, combine it with other tools, such as volume indicators or oscillators. That way, you get a deeper understanding of the market and trade more accurately.

Don’t forget to use the Moving Average Ribbon as part of a whole trading strategy. Combine its signals with fundamental analysis and risk management techniques for the best outcome. Mastering this tool and integrating it into your trading can help you succeed in the financial markets.

Benefits of Using the Moving Average Ribbon Indicator

The Moving Average Ribbon Indicator has many advantages that can improve your trading strategy. Here are five main advantages:

  1. Adaptability: It is easily adjusted to different market conditions. By using multiple moving averages, it gives an overall view of price trends, showing both short and long-term trends.
  2. Trend Confirmation: An important benefit of this indicator is its ability to confirm trends. The ribbon lines provide clear visual cues when markets change, helping you make smarter decisions.
  3. Support/Resistance: Not just identifying trends, the indicator is useful for pinpointing support and resistance levels. The ribbon lines act as shifting zones for entering/exiting trades.
  4. Volatility Assessment: You can gauge market volatility better with this indicator. Its widening or narrowing shows changes in volatility, so you can adjust strategies.
  5. Filter for Signal Accuracy: With multiple moving averages, the ribbon filters out false signals and noise. It gives a smoother representation of price action and helps you focus on high-probability setups.

The Moving Average Ribbon Indicator also has customizable settings, letting traders adjust parameters based on their preferences and style. To get the most out of these benefits, consider adding the indicator to your technical analysis toolkit. Enhance your decision-making process and stay ahead in the markets!

Understanding the Components of the Indicator

To understand the components of the moving average ribbon indicator, delve into the world of exponential moving averages (EMA) and setting up multiple EMAs for the ribbon. Each sub-section offers its own unique solution to enhance your understanding and utilization of this powerful indicator.

Exponential Moving Averages (EMA)

Exponential Moving Averages (EMA) are an essential tool used by traders and analysts to interpret and predict price trends in finance. They work by taking the sum of closing prices over a certain period and dividing it by that same number. The formula gives more weight to recent prices, meaning it’s faster to react to shifts in market sentiment. This makes it great for generating buy or sell signals with better accuracy.

Gerald Appel first developed EMAs in the late 1960s for analyzing stock market data. His groundbreaking work set the stage for technical analysis methods still used today. Since then, many traders have seen the value of EMAs and incorporate them into their plans. It’s clear that EMAs are a timeless and invaluable asset for financial decision-making.

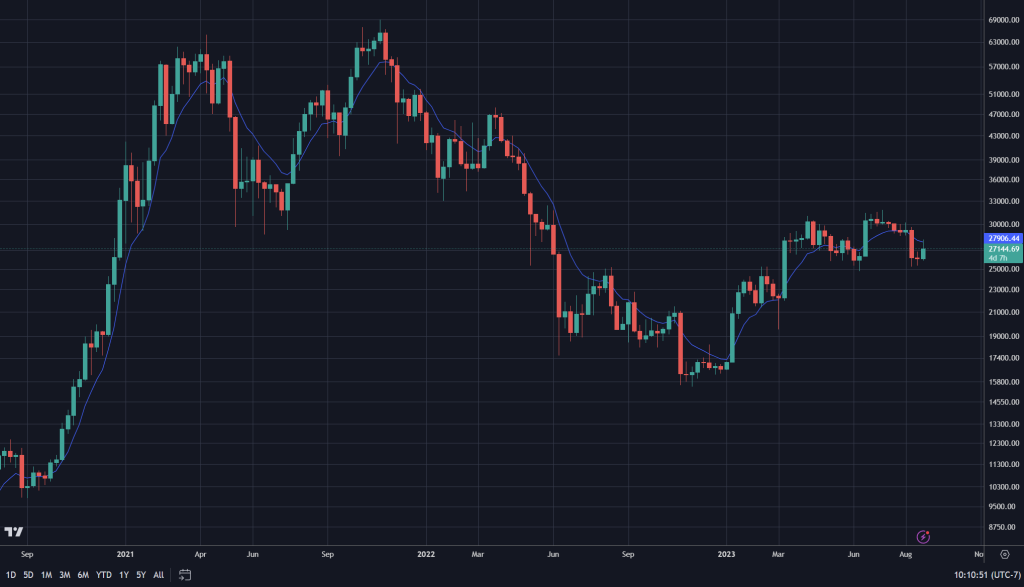
Setting Up Multiple EMAs for the Ribbon

Let’s set up multiple EMAs with different periods on the chart. This way, we can get a better view of the market trend while filtering out short-term fluctuations. We can create a ribbon pattern with these EMAs for better visibility.

We have an example here:

  • Period: 10, EMA: Blue, Color: #0072ce
  • Period: 20, EMA: Red, Color: #ff0000
  • Period: 50, EMA: Green, Color: #00cc46
  • Period: 100, EMA: Cyan, Color: #00ffff

Shorter period EMAs (e.g. 10 and 20) respond to price changes faster. Longer period EMAs (e.g. 50 and 100) capture bigger trends. By looking at the EMAs, traders can find out the market behavior. If the shorter EMAs are above the longer ones, it indicates bullish. If the shorter EMAs go below the longer ones, it suggests bearish.

Using this ribbon technique can be beneficial for technical analysis. It can give clarity and help identify trends more accurately.

John Murphy is the one who first introduced this indicator. He is a renowned technical analyst and author of “Technical Analysis of the Financial Markets”. His method changed the use of moving averages in trading strategies and helped traders make better decisions.

Interpreting the Moving Average Ribbon Indicator

To interpret the Moving Average Ribbon Indicator in order to make informed trading decisions, you need to understand how it works. This section explores the different aspects of the indicator, including identifying trends and signal generation. By delving into these sub-sections, you will gain a comprehensive understanding of how to effectively utilize the Moving Average Ribbon Indicator.

Identifying Trends

The Moving Average Ribbon Indicator assists with detecting trends. It does this by studying price changes over a given period. It plots several moving averages on the chart, showing the overall trend’s direction.

To make trend identification more precise, various combinations of moving averages can be used. For instance, the ribbon pattern formed by closely spaced moving averages could indicate a stronger trend and more momentum.

Linda Raschke was the first to introduce this indicator. Her creative approach changed trend detection approaches and helped traders make informed market decisions. The indicator stands out for its ability to fit different timeframes and detect both short-term and long-term trends.

Signal Generation

Generating signals with the moving average ribbon indicator? For traders, certain conditions and patterns are key. By analyzing the interaction of many moving averages, buy or sell signals can be detected. See the table below for specifics.

It’s important to track price movements in relationship to the ribbon and take appropriate action. To increase accuracy, traders should also consider other technical analysis tools and indicators to confirm signals.

Fun fact: The moving average ribbon indicator was made popular by technical analyst Linda Bradford Raschke.

Strategies for Using the Moving Average Ribbon Indicator

To maximize your success in using the Moving Average Ribbon Indicator, employ effective strategies. Harness the power of this tool with the Trend Following Strategy and the Reversal Strategy. Each approach offers distinct advantages that can enhance your trading decisions.

Trend Following Strategy

Trend following is an approach used by traders to spot and benefit from sustained market trends. By studying price changes over a period, traders can find the trend direction and make informed decisions. To apply this strategy, traders need various tools and indicators that give accurate trend signals. An example is the Moving Average Ribbon Indicator.

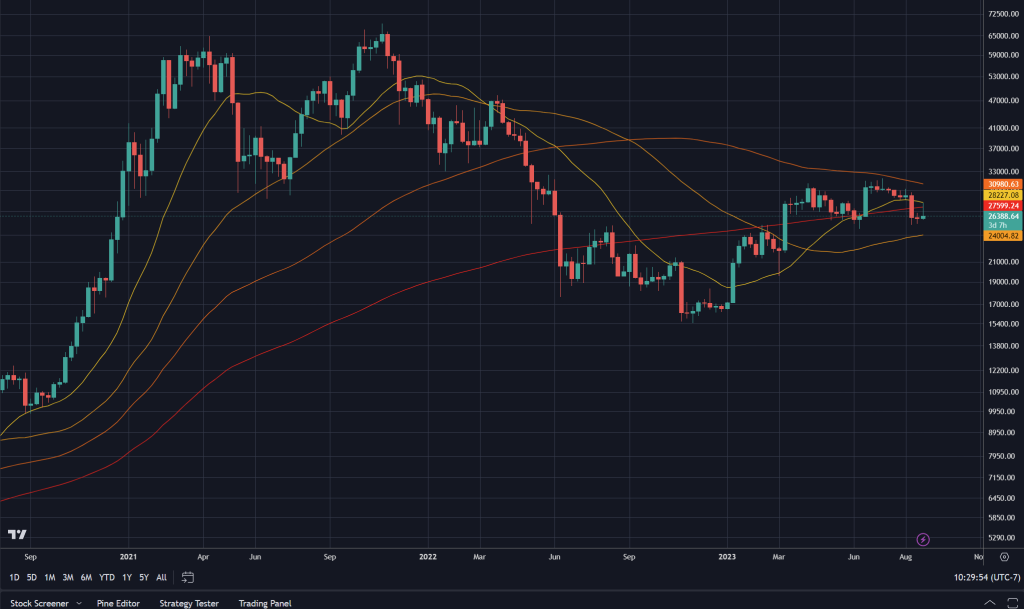
This Indicator is handy for detecting trends and potential entry or exit points. It contains several moving averages of different time periods plotted on the chart. See the table below as an example:

Moving AveragesTime Period
10-day MAShort-term
50-day MAIntermediate
200-day MALong-term

By studying the positioning of these moving averages in relation to each other and the current price, traders can see if the market is going up or down. When the shorter-term moving average crosses above or below the longer-term moving averages, it suggests a reversal or continuation.

Apart from identifying trends, this Indicator also helps traders identify support and resistance levels. If prices are staying above moving averages, it shows an uptrend with strong support. On the other hand, if prices remain below moving averages, it suggests a downtrend with strong resistance.

To benefit from this strategy, traders should use it with other technical analysis tools to get confirmation and use proper risk management techniques. By following this trend following strategy, traders can stay ahead and potentially benefit from profitable trading opportunities.

Maximize your trading potential today! Incorporate the Moving Average Ribbon Indicator into your strategy and increase your chances of success in capturing profitable trends. Stay informed, adjust to changing market conditions, and make timely trading decisions to stay ahead of the competition. Take action now and unlock your trading potential!

Reversal Strategy

A reversal strategy is a strong tool traders use to recognize potential market trend shifts. Analyzing different indicators assists traders to know when to enter or exit trades. Here we look at the essential components and techniques of a reversal strategy.

For successful reversal strategy implementation, traders have to consider multiple factors and indicators. Check out the table below for key elements:

IndicatorDescription
Moving AverageCalculates average price over a period. Helps figure out trend directions.
Candlestick PatternsAnalyzes shape and structure of price movements to forecast trend reversals.
Support and Resistance LevelsIdentifies areas where buying or selling pressure disrupts trend movements.
Volume AnalysisExamines trading volume to predict potential trend reversals.

These indicators work together to provide multiple outlooks on reversals. By studying moving averages, candlestick patterns, support and resistance levels, and volume analysis, traders can make informed decisions about entering or quitting trades.

Here are some tips for optimizing your reversal strategy:

  1. Merge multiple indicators: Using several indicators together gives more complete confirmation signals when spotting potential reversals.
  2. Change indicator settings: Try different periods or parameters for your selected indicators to find the ideal settings for your trading style.
  3. Follow price action: Keep an eye on price behavior around significant support and resistance levels. Breakouts or rejections at these levels can be strong signs of upcoming reversals.
  4. Use stop-loss orders: Set stop-loss orders to limit potential losses if a reversal doesn’t occur as predicted. This risk management approach guarantees you exit trades quickly if market conditions differ from your predictions.

By using these ideas in your reversal strategy, you can improve the accuracy and effectiveness of your trades. Always pay attention to market conditions and modify your plan as needed to fit changing trends and trading environments.

Tips and Best Practices

It’s essential to know the best practices for using the Moving Average Ribbon Indicator. Here are 3 points to keep in mind:

  1. Pick the right time frame. Shorter frames like 5/15 minutes are great for day traders, while longer frames like daily/weekly are better for swing traders or long-term investors.
  2. Confirm trend direction. Observe the slope & position of multiple moving averages to see if the market is going up or down. This helps make trading decisions.
  3. Combine with other indicators. The Moving Average Ribbon Indicator can be even more effective when used with other tools like oscillators, volume indicators, & support/resistance levels.

To maximize potential, stay educated on market news & events. Adapt your strategy & you’ll enhance trading performance with the Moving Average Ribbon Indicator. FYI, traders have been using moving averages since the start of technical analysis! This indicator has been a go-to for many markets.

To Sum up

The Moving Average Ribbon Indicator is a powerful tool for traders. It visually presents multiple moving averages, aiding in the identification of trends and potential reversals. Making informed decisions about when to trade is easier with this indicator.

Plus, it can display different timeframes simultaneously, giving a comprehensive view of the market.

Customize the indicator to fit your trading style. Change the number of moving averages displayed and their periods. This makes it suitable for short-term and long-term traders alike.

Combine this indicator with other technical analysis tools to refine your strategy. Incorporating MACD or RSI will confirm signals generated by the ribbon indicator, making trades more reliable.

This real-time insights provider is a valuable asset for traders. It eliminates guesswork and emotions from trading decisions.

Pro Tip: Use risk management techniques like setting stop-loss levels or trailing stops. This will protect your capital and minimize losses if the market turns unfavorable.

Frequently Asked Questions

FAQs for How to Use the Moving Average Ribbon Indicator:

1. What is the Moving Average Ribbon indicator?

The Moving Average Ribbon indicator is a technical analysis tool that consists of multiple moving averages plotted on a chart to identify trends and generate trading signals. It helps smooth out price fluctuations and provides a visual representation of the overall direction of an asset’s price movement.

2. How many moving averages are typically used in the ribbon?

The number of moving averages used in the ribbon indicator can vary based on individual preferences or the trading strategy employed. However, it usually consists of 3 to 10 moving averages, which are spaced out at specific intervals. The more moving averages in the ribbon, the smoother the trend representation.

3. How do I interpret the Moving Average Ribbon indicator?

When the moving averages in the ribbon are stacked in a particular order, it indicates the dominant direction of the trend. If the moving averages are lined up from smallest to largest, it suggests an uptrend, while the opposite order signifies a downtrend. Traders look for crossovers and divergences between the moving averages to identify potential entry and exit points.

4. Can I customize the Moving Average Ribbon indicator?

Yes, the Moving Average Ribbon indicator can be customized according to individual preferences. Traders can select the number of moving averages, their types (simple, exponential, weighted, etc.), and the intervals between them. These settings can be adjusted based on the time frame and volatility of the asset being analyzed.

5. How can I use the Moving Average Ribbon indicator in my trading strategy?

The Moving Average Ribbon indicator can be used in various ways to support trading decisions. Some common strategies include using crossovers of the moving averages as signal triggers, watching for divergences between price and the ribbon, and using the ribbon as a dynamic support/resistance level. It is advisable to combine the indicator with other technical tools and analysis techniques for better accuracy.

6. Which trading platforms offer the Moving Average Ribbon indicator?

The Moving Average Ribbon indicator is available on most popular trading platforms, including MetaTrader, TradingView, and Thinkorswim. Traders can access the indicator through the platform’s built-in selection of tools or by importing custom indicators created by other users.

Click to rate this post!
[Total: 0 Average: 0]

How to Use the Exponential Moving Average

Exponential Moving Average

The Exponential Moving Average (EMA) is a key tool in financial analysis. It calculates the average of a stock’s closing prices, but gives more weight to recent data. Traders and analysts use this moving average to spot trends and make wise investments.

Unlike simple moving averages, which give equal weight to all data points, the EMA focuses on recent price movements. This lets traders react quickly to changes in market sentiment.

What’s unique is the EMA’s ability to adapt. As older data points get replaced, it stays sensitive to recent price developments. So traders can stay up-to-date with the latest market trends and modify their strategies.

The concept of the exponential moving average goes all the way back to technical analysis. Richard Donchian created it while exploring trend-following strategies in the mid-20th century. His work revolutionized the field and paved the way for modern technical analysis techniques like the EMA.

Understanding the Exponential Moving Average Calculation

Comprehending & using the Exponential Moving Average (EMA) calculation is advantageous to financial analysis. It emphasizes recent data, granting a better understanding of trends. Here’s how to employ this calculation effectively.

To calculate the EMA:

  1. Pick a period to measure, e.g. days or weeks.
  2. Collect the closing prices for the chosen period.
  3. Select an alpha factor. This decides the importance of recent data points. A small factor gives greater weight to older data, whereas a large factor emphasizes more recent data.
  4. Calculate an initial Simple Moving Average (SMA) by totaling the closing prices, then dividing by the amount of periods.
  5. To get the EMA for subsequent periods, multiply the latest closing price by alpha, then add (1 – alpha) multiplied by the prior EMA value. This formula takes into account both recent data & earlier moving averages.
  6. Repeat this procedure for each period until you have the number of EMAs required.

By utilizing this calculation process, tracking trends with precision & reacting quickly to market changes is possible.

Pro Tip: Customize time periods & smoothing factors to find the optimal values for your technical analysis needs. There is no universal approach to calculating exponential moving averages; it depends on goals & objectives.

Interpreting the Exponential Moving Average

Table:

Data TypeDescription
Exponential Moving AverageA type of moving average that gives more weight to recent data points.
PeriodNumber of time periods used to calculate the moving average.
Current ValueMost recent value of the exponential moving average.
Trend DirectionIndicates upward, downward, or sideways trend.

It’s important to note that the Exponential Moving Average can be customized. This adds flexibility for traders looking to refine their analysis.

The concept of using moving averages in financial analysis dates back decades. Richard D. Donchian first introduced it in the mid-20th century. It has since become a widely used indicator in technical analysis. The development and refinement of various moving averages, including the Exponential Moving Average, help with interpreting market trends accurately.

Interpreting the Exponential Moving Average gives traders valuable insights into market behavior. They can make more informed decisions based on objective data analysis. Its historical significance and customizability make it a crucial tool in modern investment strategies.

Applying the Exponential Moving Average to Trading Strategies

EMAs (Exponential Moving Averages) are popular for trading strategies. They give recent data points more weight than others, to help with short-term trading.

See the table below – it shows how EMA can be applied for different strategies:

StrategyEMA PeriodBuy SignalSell Signal
Golden Cross50/200When shorter EMA goes above longer EMAWhen shorter EMA goes below longer EMA
Death Cross50/200When shorter EMA goes below longer EMAWhen shorter EMA goes above longer EMA
Moving Average Crossover20/50When shorter EMA goes above longer EMAWhen shorter EMA goes below longer EMA
Moving Average Crossover20/50When shorter SMA is higherWhen shorter SMA is lower

EMA signals help you decide when to buy and sell. But, they’re not 100% accurate. So, it’s important to research and analyse before you make a trade.

To get the most out of EMA, stay up to date and keep monitoring your indicators. That way, you can be prepared for potential market movements and make timely trades.

Start using EMAs in your strategy today and take your trading to the next level!

Tips for Using the Exponential Moving Average Effectively

Are you looking to utilize the Exponential Moving Average (EMA) in your trading strategy? Here are some tips to help you make the most of it!

  • Time period: Select the best timeframe for your EMA. Short timeframes, e.g. 10 or 20 days, show short-term market movements, while long ones, like 50 or 100 days, offer a broader view.
  • Multiple EMAs: Compare different timeframes to identify buy or sell opportunities through crossovers.
  • Use in conjunction with other indicators: The EMA is most effective when used with other technical indicators such as volume analysis or support and resistance levels.
  • Adapt to market conditions: During volatile markets, use shorter EMA timeframes. During stable markets, longer timeframes may be more reliable.

Remember that the EMA pays more attention to recent data points than the Simple Moving Average (SMA). Look out for crossovers between different EMA lines. A bullish crossover is when a shorter-term EMA crosses above a longer-term one – it signals an uptrend. On the other hand, a bearish crossover shows a potential downtrend when the shorter-term EMA falls below the longer-term line.

Pro Tip: Try out different EMA combinations and incorporate them into your trading system for improved accuracy!

By mastering the art of using the EMA, you can gain a better understanding of the market and make smarter trading decisions. Good luck!

To Sum Up

The EMA has great value for traders. It smooths out price data and shows trends, to help with trading decisions. It highlights recent prices more than other moving averages, so it reflects market sentiment quickly. You can adjust the EMA’s responsiveness by changing its period setting. Shorter periods mean a more sensitive EMA. Longer periods give a smoother EMA. Experiment to find what works for you.

Two EMAs with different periods can generate crossover signals when they intersect. These show potential trend reversals or confirmations. Combining the EMA with other technical indicators, like oscillators or volume measures, makes it even more effective. Together they offer a better view of market dynamics and improve trading signals.

Frequently Asked Questions

Q1: What is the Exponential Moving Average (EMA)?

A1: The Exponential Moving Average (EMA) is a type of moving average that gives more weight to recent data points, making it more responsive to price changes. It smooths out price fluctuations and helps identify trends in the market.

Q2: How is EMA calculated?

A2: EMA is calculated using a formula that takes into account the smoothing factor and previous EMA value. The formula is: EMA = (Close – EMA(previous day)) * (smoothing factor) + EMA(previous day)

Q3: What is the significance of the smoothing factor in EMA calculation?

A3: The smoothing factor determines the weight given to the most recent data points. A higher smoothing factor will place more emphasis on recent prices, making the EMA more responsive to recent changes. Traders can adjust the smoothing factor based on their trading strategy and time frame.

Q4: How can EMA be used in trading?

A4: EMA can be used to generate buy or sell signals. When the price crosses above the EMA, it may indicate a bullish trend and suggest a buy signal. Conversely, when the price crosses below the EMA, it may indicate a bearish trend and suggest a sell signal. Traders often use multiple EMAs with different time periods to confirm signals.

Q5: Are there any limitations of EMA?

A5: EMA, like any indicator, is not foolproof and can produce false signals. It may lag during periods of high volatility or sudden price reversals. Traders should consider using EMA in conjunction with other indicators and tools for more reliable analysis.

Q6: Can EMA be applied to any financial instrument?

A6: Yes, EMA can be applied to various financial instruments such as stocks, currencies, commodities, and indices. It is commonly used in technical analysis to identify trends and make informed trading decisions.

Click to rate this post!
[Total: 0 Average: 0]

How to Use the Moon Phases Indicator

Moon Phases Indicator

The Moon Phases Indicator is a powerful tool for navigating life’s ups and downs. By understanding its phases, you can harness the moon’s energy and make better decisions. This article will explore how to use the Indicator and maximize its benefits.

The moon goes through eight distinct phases, from New Moon to Full Moon and back again. Each phase has its own significance and energy that can influence us. Aligning our actions with these phases can tap into their power.

The New Moon symbolizes new beginnings and fresh starts. It is ideal for setting intentions, starting projects, and making personal transformations. Focus on self-reflection and intention-setting to create a clear vision of your goals.

The Waxing Crescent phase encourages taking action towards your goals. It represents growth, abundance, and momentum. Use this time to implement your plans and manifest your desires.

The First Quarter Moon tests commitment. It’s about overcoming obstacles and pushing through limitations. Evaluate your progress and make any adjustments.

The Waxing Gibbous phase is nearing completion or fulfillment. Fine-tune your efforts and make any final adjustments.

The Full Moon is powerful. Emotions are heightened, intentions are magnified, and energies are at their peak. Do manifestation rituals like writing down desires or doing meditation and visualization exercises.

The Waning Gibbous phase is about releasing what no longer serves you. Let go of old patterns, beliefs, and relationships. Create room for new opportunities.

The Third Quarter Moon is for reflection and assessment. Do self-evaluation and recognize areas of improvement.

The Waning Crescent phase is for rest and rejuvenation. Take time for self-care and relaxation. Integrate lessons learned and prepare for future endeavors.

Using the Moon Phases Indicator means aligning your actions with each phase’s energy. Maximize its benefits and live a more intentional life. Let the moon guide you on a journey of self-discovery and growth!

Understanding the Moon Phases Indicator

The Moon Phases Indicator is a must-have for understanding the lunar cycle. It reveals insights about the moon’s stages and how to tap into its energy.

Let’s look at a table that shows the important details:

Moon PhaseDescription
New MoonStart of cycle
Waxing CrescentSmall illuminated sliver
First QuarterHalf illuminated
Waxing GibbousLarge illuminated portion
Full MoonEntirely illuminated
Waning GibbousDecrease in illumination post full moon
Third QuarterHalf illuminated again
Waning CrescentDiminishing sliver before new moon

Did you know each phase has significance, not only for positioning but also for energy? For instance, during a waxing crescent phase, intentions and new projects begin well.

An example is an artist without inspiration. During a waning gibbous phase, they went to nature under a full moon. The tranquility and moonlight brought creativity, teaching them about the connection between creativity and lunar energies.

Benefits of Using the Moon Phases Indicator

The Moon Phases Indicator brings many advantages to our daily lives. It helps us sync our activities with nature’s rhythm, raising our effectiveness and productivity. It also assists us in planning events or achievements with the astrological significance of each phase in mind. Furthermore, it helps us understand how the moon phases affect our emotions and energy, so that we can make wiser decisions. Utilizing the power of the moon through this indicator can also benefit goal-setting and manifestation. Last but not least, it encourages mindfulness and a deeper connection with nature.

Yet, there are still undiscovered elements to using the Moon Phases Indicator. Different cultures have been using this technique for centuries, for plentiful harvests and balance in their societies. This old knowledge has spread across the world, and is now appreciated by people from diverse backgrounds.

One amazing story is about Jenny, a struggling businessperson. At her wits’ end, she decided to give the Moon Phases Indicator a go. To her delight, by timing her product releases, promotional strategies, and choices to the moon phases, her business flourished. This indicator enabled her to efficiently employ cosmic energy, and make wise selections.

The Moon Phases Indicator holds great potential for improving our lives, and uniting us with the ever-changing cycles of nature. Embracing this unique tool can bring personal growth, enhance decision-making skills, and help us to live in harmony with the celestial forces—a chance not to be missed!

Step-by-Step Guide on Using the Moon Phases Indicator

  1. Know the Indicator. Learn its layout and how it shows the phases.
  2. Locate Yourself. This affects when and how you see the moon.
  3. Check the Phase. See which one it is now.
  4. Observe & Record. Note the shape, brightness, and changes.
  5. Compare to Indicator. Make sure your observations match what it says.
  6. Learn More. Find resources that give in-depth info about lunar cycles.

Now you can use the Indicator to gain a better understanding of lunar phases and appreciate their beauty.

Arnold Lieber’s “The Lunar Effect” is an excellent source of knowledge about how lunar phases affect us and nature.

Tips and Best Practices for Using the Moon Phases Indicator

The Moon Phases Indicator is a powerful tool for life. Here’s how to use it:

  • Familiarize yourself with the eight moon phases – including the new moon, waxing crescent, first quarter, waxing gibbous, full moon, waning gibbous, third quarter, and waning crescent.
  • Pay attention to how each phase impacts your emotions, energy levels, & wellbeing.
  • Set intentions during the new moon, and release during the full moon.
  • Incorporate rituals to align with each phase.
  • Connect with nature to deepen your understanding.

Keep in mind that everyone’s experience with the moon phases can be different. Tune in to how you personally resonate with each phase. Make the most of this indicator by incorporating these tips into your daily life. Don’t miss out on its transformative potential. Align with the moon’s cycles to unlock growth, self-discovery, & manifestation.

To Sum Up

As we wrap up this journey into the Moon Phases Indicator, it’s clear it has immense potential. It guides us and helps us make decisions in harmony with our true selves.

This indicator is like a companion. It shows us the way and provides clarity. Through it, we can feel connected to the universe.

It teaches us to go with the flow. It reminds us that change is part of life. We can find peace in knowing each phase carries its own energy.

To make the most of this tool, it’s best to observe the moon regularly. Set goals at new moons, reflect on achievements at full moons, use rituals, meditate, and journal. This will help us understand how lunar phases shape our lives. We’ll become more aware of ourselves and gain more growth.

Frequently Asked Questions

What is the Moon Phases Indicator?

A: The Moon Phases Indicator is a tool used to track and predict the phases of the moon. It provides information about the current phase and the upcoming phases of the moon.

How does the Moon Phases Indicator work?

A: The Moon Phases Indicator works by using data from astronomical observations to determine the position and orientation of the moon relative to the sun. By analyzing this information, it can accurately predict the different phases of the moon.

How can I use the Moon Phases Indicator?

A: To use the Moon Phases Indicator, you need to input your location or select it from a pre-defined list. The indicator will then provide you with a visual representation of the current moon phase and information about the upcoming phases.

Why is it helpful to track moon phases?

A: Tracking moon phases can be helpful for various activities such as gardening, fishing, and even planning outdoor events. It allows you to know the moon’s position in the lunar cycle, which can affect tides, animal behavior, and even human emotions.

Can the Moon Phases Indicator be used for any location?

A: Yes, the Moon Phases Indicator can be used for any location around the world. It takes into account the latitude and longitude of the specified location to provide accurate moon phase predictions.

Is the Moon Phases Indicator scientifically accurate?

A: Yes, the Moon Phases Indicator is based on scientific calculations and astronomical data. It uses precise algorithms to calculate the moon’s position and phase, making it highly accurate.

Click to rate this post!
[Total: 0 Average: 0]