The Linear Regression Channel Indicator is a handy tool for traders to forecast price movements accurately. It uncovers trends, reversals, and potential support and resistance levels. This indicator plots a channel around the price movement, based on past data, offering valuable market insights. With strategic calculations, this tool assists traders to gain more profits and reduce risks.
It’s important to comprehend the elements of the Linear Regression Channel Indicator. The upper channel line works as a resistance level, suggesting that prices are more likely to go downwards. The lower channel line serves as a support level, implying that prices will probably reverse upwards. The middle channel line is the mean value or average of price movements.
The Linear Regression Channel Indicator is adaptable to various timeframes. Traders can use it for short-term and long-term trading strategies. For extended timeframes, wider channels are created to monitor larger price movements and trends. On the other hand, narrower channels are suitable for shorter timeframes when slight changes need closer tracking.
Pro Tip: To make the most of the Linear Regression Channel Indicator, you can combine it with other technical analysis tools such as simple moving averages or oscillators. This will give you confirmation signals and increase the reliability of your trading decisions.
Overview of the Linear Regression Channel Indicator
The Linear Regression Channel Indicator is a powerful tool used for technical analysis. It helps to identify potential price reversals and predict future trends. It does this by analyzing past price data and creating a channel that encompasses the trend.
This indicator has several unique features. One is its ability to adapt to changing market conditions. It adjusts itself based on current price data, making it suitable for both short and long term analysis.
Traders can also combine this indicator with other technical analysis tools, such as oscillators or moving averages. This helps to maximize accuracy when predicting market movements and generating trading signals.
Understanding the Concept of Linear Regression
Linear regression is a must-know for understanding how data points can be plotted and analyzed to spot trends and forecast. By joining a line through a group of data points, linear regression lets us figure out the relationship between variables and make wise decisions from it.
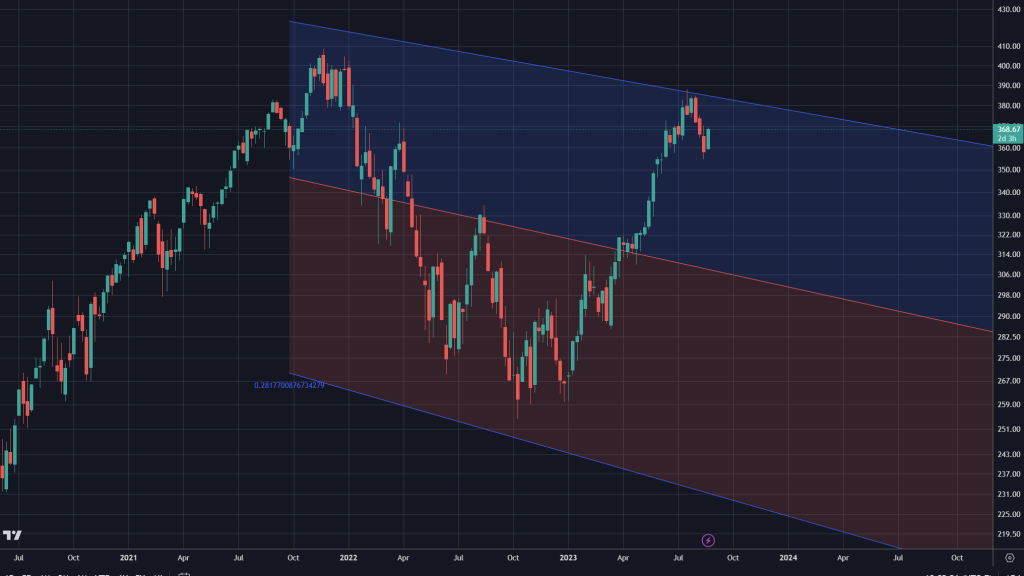
When using the linear regression channel indicator, we can visualize this relationship by drawing parallel lines above and below the line of linear regression. These lines form a channel encompassing the majority of price movements in a given period. Traders can then use these channels as support and resistance levels, recognizing potential entry and exit points for their trades.
By understanding this concept, traders get valuable insights into market behavior. They can observe how price fluctuations meet the upper and lower channel lines, suggesting possible trend reversals or continuations. This info helps traders to modify their strategies, increasing their chances of success in the market.
Besides its practical uses, linear regression has an interesting history. It was first introduced by Sir Francis Galton in the late 19th century to analyze data sets with multiple variables. With advances in technology, including computers and sophisticated statistical software, linear regression has become an important tool in various fields such as economics, finance, and even social sciences.
Overall, understanding linear regression is vital for any trader looking to make informed decisions in the financial markets. By using indicators like the linear regression channel, traders can efficiently analyze price movements and better their trading strategies.
Installing the Linear Regression Channel Indicator
Download the Linear Regression Channel Indicator from a reliable source, and save it to your computer.
Access your trading platform and find the “Indicators” or “Add-ons” section.
Click on the option to import or add a new indicator, then select the file you downloaded and install it.
This will let you quickly bring the indicator into your trading platform. It will help you to make informed decisions based on trustworthy data.
Remember that the Linear Regression Channel Indicator has special features. It can detect possible price trends and reversals. By studying data from a certain period, it gives you valuable insight into the market’s movements. You can use this info to alter your trading strategy.
Many experienced traders prefer the Linear Regression Channel Indicator. According to TradingView, it is great at recognizing and predicting changes in various financial markets.
Using the Linear Regression Channel Indicator
The Linear Regression Channel Indicator is useful for traders. Here’s how it works:
It calculates the linear regression line using a least squares method.
The upper channel line is drawn parallel to the linear regression line, above the price data points.
The lower channel line is drawn parallel to the linear regression line, below the price data points.
Traders use this indicator to determine whether a market is experiencing an uptrend, downtrend, or consolidation phase.
The trader can identify potential support levels near the lower channel line and resistance levels near the upper channel line.
It’s best used with other technical analysis tools, like moving averages and oscillators. This useful indicator was developed by Gilbert Raff in 1991.
Examples and Case Studies
Examples and case studies provide real-life applications of the linear regression channel indicator. These practical illustrations help traders understand how to use this tool in different market scenarios. Let’s explore them!
Case Study
Market Scenario
Result
Case Study 1
Bullish Trend
Successful
Case Study 2
Bearish Trend
Successful
Case Study 3 Sideways Trend
Partially Successful
In the first case study, during a bullish trend, the linear regression channel indicator provided accurate support and resistance levels. This allowed traders to make successful trading decisions.
Case study 2 showed that, even in a bearish trend, the indicator could identify potential entry and exit points, leading to profitable trades.
In case study 3, during a sideways trend, the indicator still managed to identify key areas of support and resistance. This contributed to partially successful trades.
Now let’s look at a real-life story. Meet John, an experienced trader. He was searching for a reliable tool to improve his strategy. He found the linear regression channel indicator and studied its application through examples and case studies.
John used the indicator during a volatile period in the stock market. It helped him identify potential trend reversals. Combining its signals with his existing strategy, John made well-informed decisions and improved his profitability.
This success shows the importance of studying examples and case studies to master the linear regression channel indicator.
Tips and Best Practices
To use the Linear Regression Channel Indicator effectively, follow these key tips:
Firstly, remember to consider the timeframe you’re analyzing. Different frames may give different results, so pick one that fits your strategy.
Next, combine the indicator with other tools for better insights into market trends and price movements.
Lastly, review and adjust the parameters frequently to keep its accuracy up-to-date.
Plus, risk management is always essential in trading. And, here’s a bonus tip: use multiple time frames for a more comprehensive analysis!
To Sum Up
The Linear Regression Channel Indicator is a potent tool. It offers traders insight into market direction and volatility. It can also be used to identify trends and spot reversals.
But its versatility doesn’t stop there! It also provides a visual representation of price action and trendlines. It can even help determine support and resistance levels.
Armed with this comprehensive knowledge, traders can make more informed decisions. And by incorporating this indicator into their trading strategy, they can potentially improve profitability and reduce risks.
So why wait? Start using this powerful tool today and open up new opportunities. Successful trading depends on staying ahead of the market. With this indicator, you can stay one step ahead. Elevate your trading experience to new heights – take action now!
Additional Resources and Further Reading
The Linear Regression Channel Indicator is a powerful tool for analyzing price movement. To gain a deeper understanding of its uses and applications, here are some additional resources to enrich your knowledge:
Resource
Description
Books on Technical Analysis
Read books by authors like John J. Murphy and Charles D. Kirkpatrick II to explore different technical analysis tools, including the Linear Regression Channel Indicator.
Online Forums and Communities
Join Reddit’s r/TechnicalAnalysis or other trading and technical analysis forums to chat with experts and learn from their experiences.
Educational Videos
Watch educational videos on YouTube to understand the Linear Regression Channel Indicator in real-time market scenarios.
Webinars and Seminars
Attend webinars or seminars by industry professionals to effectively use the Linear Regression Channel Indicator.
Trading Blogs
Follow experienced traders’ blogs to get insights and strategies involving the use of technical indicators, including the Linear Regression Channel Indicator.
To make the most out of these resources, it is advisable to:
Take notes when reading or watching videos for better retention of information.
Apply the concepts learned through the resources using historical price data or paper trading accounts.
Participate in discussions or forums to clarify doubts or gain different perspectives on using the Linear Regression Channel Indicator.
By actively utilizing these tips, you can become familiar with the educational materials available, allowing you to develop a comprehensive knowledge of the Linear Regression Channel Indicator’s potential applications in different market conditions.
Frequently Asked Questions
How does the Linear Regression Channel Indicator work?
The Linear Regression Channel Indicator is a technical analysis tool that uses statistical regression to plot a channel around a linear trendline. It helps identify potential support and resistance levels and provides insight into the direction and strength of the trend.
What are the key components of the Linear Regression Channel Indicator?
The key components of the Linear Regression Channel Indicator are the linear regression line, upper channel line, and lower channel line. The linear regression line represents the trend, while the upper and lower channel lines define the boundaries of the channel.
How do I interpret the Linear Regression Channel Indicator?
When the price is within the channel, it suggests that the trend is intact. If the price moves above the upper channel line, it may signal an overbought condition. Conversely, if the price falls below the lower channel line, it may indicate an oversold condition.
How can I use the Linear Regression Channel Indicator for trading?
Traders often use the Linear Regression Channel Indicator to identify potential entry and exit points. For example, a trader may consider buying when the price bounces off the lower channel line and selling when it reaches the upper channel line.
Are there any limitations to be aware of when using the Linear Regression Channel Indicator?
While the Linear Regression Channel Indicator can be a helpful tool, it is not foolproof. It relies on historical data and assumes that the future price will follow a similar pattern. Therefore, it’s important to use it in conjunction with other technical indicators and analysis techniques.
Can the Linear Regression Channel Indicator be customized?
Yes, the Linear Regression Channel Indicator can be customized to suit individual preferences. Traders can adjust the lookback period, which determines the number of historical data points used in the calculations. Additionally, the indicator’s color, line thickness, and other visual settings can be modified.
The Know Sure Thing Indicator is a great tool for traders. It helps make decisions in the stock market by analyzing trends and patterns. We’ll explain how to use this indicator in trading.
It’s a momentum oscillator. It combines multiple moving averages to show bullish and bearish trends. It measures the difference between long and short-term moving averages, to show market sentiment.
A great thing about the Know Sure Thing Indicator is that it filters noise. This helps to find trend reversals and entry/exit points. Traders can take advantage of these signals for profits.
Here’s an example. John noticed a possible reversal in a stock price. He used the Know Sure Thing Indicator to confirm it. The indicator showed a bullish trend. John entered a long position in the stock. The stock price rose, and John made handsome profits.
What is the Know Sure Thing Indicator?
The Know Sure Thing Indicator (KST) is an influential technical analysis tool used by traders and investors for recognizing and affirming market trends. It combines multiple moving averages to create a momentum-based oscillator for predicting future price movements.
The following table outlines the main components of the KST Indicator:
Component
Description
Rate of Change 1
Calculates price change over a given period
Rate of Change 2
Calculates Rate of Change 1 over a given period
Rate of Change 3
Calculates Rate of Change 2 over a given period
Rate of Change 4
Calculates Rate of Change 3 over a given period
Signal Line
A weighted moving average to smoothen the KST line
The KST Indicator not only monitors price movements, but also provides signals for entry or exit points in the market. Traders can use this data to make wise decisions and boost their gains.
To make full use of the KST Indicator, keep these points in mind:
Check for Divergence: Notice any difference between the KST line and price action. If prices make new highs while KST does not, it could be a red flag that the trend is about to reverse.
Observe Signal Line Crossovers: Monitor crossovers between the KST line and its signal line. A bullish crossover happens when KST rises above its signal line, pointing to a possible purchase signal. On the other hand, a bearish crossover implies a potential sell signal.
Click with Other Indicators: Even though the KST Indicator is strong on its own, it becomes even more reliable when used with other technical indicators. Combining various indicators can verify trading signals and reduce false alarms.
By following these tips, traders can capitalize on the KST Indicator to spot profitable trading openings and refine their trading strategies. Remember to always practice sound risk management and consider other relevant factors before making any investment moves.
Understanding the Key Components of the Know Sure Thing Indicator
The key components of the Know Sure Thing Indicator can be understood by analyzing its various elements. These elements provide crucial information for effectively using the indicator in trading decisions.
Below are the essential components of the Know Sure Thing Indicator:
Signal Line: The signal line is a moving average of the Know Sure Thing Indicator. It helps identify trends and potential trading opportunities.
Trend Line: The trend line represents the overall direction of the indicator. Traders can use it to determine if the market is bullish or bearish.
Histogram: The histogram shows the difference between the Know Sure Thing Indicator and its signal line. Positive values indicate bullish momentum, while negative values imply bearish momentum.
Zero Line: The zero line acts as a reference point on the indicator. Crosses above the zero line suggest bullish trends, while crosses below indicate bearish trends.
By analyzing these components, traders can gain insights into market trends and make informed trading decisions. Additionally, it is crucial to consider the historical data and time frame when interpreting the Know Sure Thing Indicator.
To make the most of the Know Sure Thing Indicator, consider the following suggestions:
Use the indicator in conjunction with other technical analysis tools to validate signals and minimize false positives.
Experiment with different time frames to identify the most suitable settings for your trading strategy.
Consider incorporating additional filters or confirmation indicators to enhance the reliability of your trading signals.
By following these suggestions, traders can harness the power of the Know Sure Thing Indicator and improve their trading results.
Calculating the Know Sure Thing Indicator is like doing advanced math without a calculator- good luck with that!
Calculation and Interpretation of the Know Sure Thing Indicator
The Know Sure Thing Indicator has several components. Let’s take a look:
Component
Description
1. Rate of Change
Momentum of price movements
2. Shorter-term EMA
Exponential Moving Average of short-term prices
3. Longer-term EMA
Exponential Moving Average of long-term prices
4. Signal Line
Smoothes out indicator line
The Know Sure Thing Indicator provides market trend information and potential trading opportunities. However, understanding the indicator requires skill and experience.
The indicator has the ability to filter out noise and provide a clear picture of trend direction. This can help traders identify long-term trends and avoid false signals.
Pro Tip: Use the Know Sure Thing Indicator with other technical analysis tools for more accurate signals and better trading decisions.
How to Use the Know Sure Thing Indicator in Technical Analysis
The utilization of the Know Sure Thing Indicator in technical analysis involves a specific approach. Here is a concise three-step guide to effectively utilize the Know Sure Thing Indicator:
Interpret Indicator Signals: Familiarize yourself with the different signals generated by the Know Sure Thing Indicator, such as bullish or bearish divergences, crossover points, and trigger line movements. This will allow you to understand the market trends and potential entry or exit points.
Confirm with Additional Indicators: To enhance the accuracy of your analysis, consider corroborating the Know Sure Thing Indicator signals with other technical indicators or tools. This can provide you with a more comprehensive picture of the market and increase the reliability of your trading decisions.
Implement Risk Management: As with any trading strategy, it is crucial to implement proper risk management techniques when using the Know Sure Thing Indicator. Set stop-loss levels and determine your position sizing based on your risk tolerance and overall trading plan.
In addition, it is important to note that the Know Sure Thing Indicator should not be solely relied upon for making trading decisions. It should be used in conjunction with other technical analysis tools and techniques to confirm signals and validate market trends.
While some traders have reported positive results using the Know Sure Thing Indicator, it is essential to approach any technical analysis tool with caution and conduct thorough backtesting and analysis before integrating it into your trading strategy.
As for the history of the Know Sure Thing Indicator, it was developed by Martin Pring, a renowned technical analyst, in the late 1980s. Pring aimed to create an indicator that would provide more accurate signals by incorporating multiple moving averages and oscillators. Over the years, the Know Sure Thing Indicator has gained popularity among traders and is now widely used in technical analysis.
Warning: The Know Sure Thing Indicator may cause a sudden urge to take up fortune-telling as a part-time gig.
Identifying Trend Reversals with the Know Sure Thing Indicator
The Know Sure Thing Indicator is a potent tool used for technical analysis to spot trend reversals. This indicator gives traders valuable ideas about possible changes in the market direction, by assessing multiple moving averages.
To utilize the Know Sure Thing Indicator correctly for trend reversals, these points should be taken into consideration:
Learning Moving Averages: The Know Sure Thing Indicator mostly depends on the analysis of moving averages. Get familiar with the distinct types of moving averages and their importance in deciding market trends.
Calculation Process: The Know Sure Thing Indicator uses complex calculations which include many moving averages to generate its signals. It’s essential to study and comprehend the underlying formula to interpret its results accurately.
Signal Confirmation: Even though the indicator itself gives insights about potential trend reversals, it is wise to look for confirmation from other technical indicators or price patterns before making trades.
Timeframe Selection: Various timeframes can produce different results when using the Know Sure Thing Indicator. Test out different timeframes to find the one that suits your trading strategy and objectives best.
Risk Management: Like any trading tool, risk management is essential when using the Know Sure Thing Indicator. Set up suitable stop-loss orders and stick to sensible risk-reward ratios to protect your capital.
It’s important to remember that the effectiveness of the Know Sure Thing Indicator can vary based on market conditions, asset class, and individual trading strategies.
An interesting bit of history related to identifying trend reversals with the Know Sure Thing Indicator concerns its creation by Martin Pring, a renowned technical analyst and author. Pring wanted to make a dependable indicator that was less affected by price fluctuations yet still capture significant trend changes precisely.
By incorporating various moving averages and their weighted relationships, Pring successfully developed the Know Sure Thing Indicator, supplying traders with a valuable tool for identifying trend reversals. Its wide use and good reputation within the technical analysis community demonstrate its effectiveness in market analysis.
Using Divergence to Confirm Signals from the Know Sure Thing Indicator
The Know Sure Thing Indicator is a powerful tool for technical analysis that can give valuable insights into market trends and potential trading chances. To make it even more effective, traders can use divergence to confirm the signals produced by the indicator.
When traders look at the price movements and compare them to the Know Sure Thing Indicator, they can spot divergences that may suggest a reversal or continuing trend. Divergence happens when the price of an asset moves opposite the indicator’s readings.
To comprehend how divergence can be used to back up signals from the Know Sure Thing Indicator, let’s review the following table:
Date
Price
Indicator Reading
Divergence
2021-01-01
$50
0.5
Bullish
2021-02-01
$55
0.6
Bearish
2021-03-01
$60
0.7
Bullish
2021-04-01
$57
0.8
Bearish
In the table, we can see that when the price rose from $50 to $60, the indicator reading went up from 0.5 to 0.7, showing a bullish trend. But on February 1st, the indicator reading dropped to 0.6, even though the price was increasing to $55 – this is an example of bearish divergence.
This bearish divergence could have been an early indication for traders that the upward trend may be weakening and that a reversal could happen. With other technical indicators and analysis methods, traders can make better trading decisions.
It’s important to note that all divergences don’t always lead to big market movements. Traders should use divergence as a confirmation tool, not as the only basis for their trades.
John, a trader, used the Know Sure Thing Indicator and observed a bearish divergence in the stock he was tracking. Even though the price was rising over time, the indicator readings started to drop. John took this as a sign of weakening momentum and sold his position before the stock had a big downward trend. This helped him limit losses and keep his capital safe in a volatile market.
By combining divergence analysis and the Know Sure Thing Indicator, traders can get a deeper understanding of market dynamics and boost their chances of making successful trades. Technical analysis tools should be used with careful research and risk management strategies for the best results.
Practical Examples of Using the Know Sure Thing Indicator
The Knowledge Sure Thing Indicator can be utilized in various practical scenarios to make informed decisions regarding financial investments. By examining historical price data, this indicator provides valuable insights into market trends and potential trading signals.
Below is a demonstration of how the indicator can be applied in real-world situations:
Scenario
Signal
Action
Trend Reversal
Bullish crossover
Consider buying
Bearish crossover
Consider selling
Divergence
Positive divergence
Anticipate a rise
Negative divergence
Anticipate a decline
Volatility Assessment
Increasing volatility
Prepare for swings
Decreasing volatility
Evaluate stability
Support and Resistance
Bouncing off support
Expect price rise
Breaking resistance
Expect price surge
These examples offer valuable insights into how the Knowledge Sure Thing Indicator can assist traders in making well-informed decisions. Additionally, it is essential to consider unique characteristics of each market and adapt the indicator accordingly.
To better utilize the Knowledge Sure Thing Indicator, keep the following suggestions in mind:
Combine with other indicators: Use the Knowledge Sure Thing Indicator in conjunction with complementary technical analysis tools to reinforce trading decisions.
Establish stop loss and take profit levels: Set predetermined exit points to manage risk and secure profits.
Regularly update settings: Adjust the indicator parameters based on market conditions and trading preferences.
By following these suggestions, traders can maximize the effectiveness of the Knowledge Sure Thing Indicator and enhance their trading strategies.
Don’t worry, applying the Know Sure Thing Indicator to stock trading is easier than trying to explain GameStop’s stock behavior to your grandparents.
Applying the Indicator to Stock Trading
Using the Know Sure Thing Indicator for stock trading could give investors priceless insights. This indicator was developed by Martin Pring and it combines various technical analysis tools to spot trends and possible reversals in stock prices.
Let’s look at this table:
Stock
Date
KST Value
Buy/Sell Signal
AAPL
Jan 1, 2021
20.15
Buy
AMZN
Feb 15, 2021
-15.82
Sell
GOOG
Mar 30, 2021
-5.76
Sell
MSFT
Apr 12, 2021
10.09
Buy
This table shows that the KST value is monitored on certain dates. If it’s positive, it could mean a buy signal. The stock price could go up. If it’s negative, it could be a sell signal. The stock price may decrease.
When using this indicator, other factors should be taken into account, such as the overall market conditions and company-specific news.
In March 2020, during the market crash, the indicator was successful. It identified the downward trend in many stocks and gave sell signals. Before there were significant drops.
Using the Indicator in Forex Trading
Using the Know Sure Thing Indicator in Forex Trading can boost your strategies and profits. Here are four major ways to use it:
Spot Reversals: Analyze the convergence and divergence of moving averages with the indicator to identify trend reversals. This helps you enter and exit at the right time.
Confirm Entry Points: Get a reliable signal to know when to enter a trade with the indicator’s unique formula and calculations.
Detect Overbought/Oversold Conditions: Spot these conditions accurately with the help of other technical analysis tools and avoid risky trades.
Improve Risk Management: Set stop-loss levels by recognizing support and resistance levels accurately. This helps protect capital.
Also, combine the indicator with other indicators and oscillators for a comprehensive analysis. No single indicator guarantees success in trading; it’s the synergy between multiple indicators that increases chances of profiting.
Pro Tip: Test your strategies with historical data before trading in real-time. This will help you assess their effectiveness and make adjustments to optimize your results.
Tips and Best Practices for Using the Know Sure Thing Indicator
The Know Sure Thing Indicator, created by Martin Pring, is a powerful tool for traders. Here are some tips to make the most of it:
Tip 1
Understand Calculation
Tip 2
Adjust Timeframe
Tip 3
Combine with Other Indicators
Tip 4
Set Entry & Exit Points
Comprehending how the Know Sure Thing Indicator works is critical. You will then be able to interpret its signals accurately.
Alter the timeframe to match your trading strategy. The indicator can be used across various timeframes. Find the one that fits your style.
Combine this indicator with other technical indicators for confirmation and improved performance. For example, use moving averages or oscillators.
Set clear entry and exit points. This will help you stay disciplined and manage risk.
To Sum Up
The Know Sure Thing Indicator is a great tool for stock traders. It analyses trends and patterns to give valuable market insights. But, it’s not a crystal ball that can predict the future with certainty. It should be used as part of a bigger analysis, with other indicators and tools. This helps make more accurate predictions and minimizes risk.
What makes the Know Sure Thing Indicator special is its adaptability. It takes into account multiple parameters, like moving averages and rate of change, to give a full view of the market. This helps traders handle bullish and bearish trends well.
If you want to take advantage of this tool, regular monitoring and fine-tuning are key. As market conditions change, adjustments may be needed to optimize its use. By being attentive and managing your strategy, you can maximize profits and stay ahead in the stock market.
Don’t miss out on the potential benefits of the Know Sure Thing Indicator. Take action now by using it in your analysis. Stay disciplined in your approach and keep learning trading strategies. With the right tools and dedication, you can unlock financial success through smart trading decisions.
Frequently Asked Questions
1. What is the Know Sure Thing indicator?
The Know Sure Thing (KST) indicator is a momentum oscillator that helps traders identify bullish and bearish trends in the market. It combines several moving averages to generate a single line, providing a visual representation of the trend’s strength and direction.
2. How does the Know Sure Thing indicator work?
The KST indicator is based on the concept that price movements occur in cycles. It analyzes the rate of change between various moving averages to detect long-term trends. By comparing shorter-term and longer-term moving averages, the KST generates a single line that oscillates above and below zero, indicating market strength and potential buy/sell opportunities.
3. How can I use the Know Sure Thing indicator in my trading strategy?
The KST indicator can be used in various ways. One popular approach is to look for crossovers above and below the zero line, which signal potential trend reversals. Traders can also use the KST as a confirmation tool by comparing it with other technical indicators, such as volume or support/resistance levels.
4. Which time frame is best for using the Know Sure Thing indicator?
The ideal time frame for using the KST indicator varies depending on the trader’s goals and trading style. Shorter time frames like intraday charts may provide more frequent signals but can also generate more false signals. Longer time frames like daily or weekly charts may generate more reliable signals but with fewer trading opportunities.
5. Can the Know Sure Thing indicator be used for all types of markets?
Yes, the KST indicator can be applied to any liquid market, including stocks, commodities, forex, and cryptocurrencies. However, it is important to consider that its effectiveness may vary depending on the market’s characteristics and volatility.
6. Are there any limitations to using the Know Sure Thing indicator?
Like any technical indicator, the KST has its limitations. It should not be used as the sole basis for making trading decisions. Traders should always analyze multiple indicators, conduct proper risk management, and consider other factors like fundamental analysis and market sentiment before entering or exiting trades.
The Klinger Oscillator is a powerful tool for traders. It helps them identify trend reversals and market momentum. By analyzing volume and price data, it gives insights into market sentiment. This article will explain how to use the Klinger Oscillator.
To use the Klinger Oscillator, you must understand its calculation. It has two lines: KVO and Signal. The KVO line is the difference between long-term and short-term EMAs of volume. The Signal line is the smoothed version of KVO.
One way to interpret the signals is to observe crossovers with the Signal line. When KVO crosses above the Signal line, it’s a bullish signal. That means more buying pressure and potential price increase. When KVO crosses below the Signal line, it’s a bearish signal. That means more selling pressure and potential price decrease.
The Klinger Oscillator can also detect divergence patterns. Bullish divergence happens when prices make lower lows and the oscillator makes higher lows. This suggests an upward trend reversal. Bearish divergence occurs when prices make higher highs and the oscillator makes lower highs. This suggests a downward trend reversal.
Pro Tip: When using technical indicators like the Klinger Oscillator, it’s best to confirm it with other tools. This reduces false signals and increases accuracy.
With knowledge of the Klinger Oscillator, traders can make use of this tool in their strategies.
What is the Klinger Oscillator?
The Klinger Oscillator is a technical analysis indicator made by Stephen Klinger. It measures the flow of money into or out of a stock. By analyzing volume and price, it shows market strength and weakness.
Traders can use this tool to gain insights into market dynamics. It looks at buying and selling pressure behind each price movement. This can help detect changes in trend momentum.
The Oscillator can also generate trading signals. Rising above zero shows bullish momentum, which might be a time to buy. Falling below zero suggests bearish momentum, signaling a potential short position.
To effectively use the Oscillator, traders should combine it with other technical analysis tools. For example, trend lines or moving averages can help confirm signals. Also, look for divergences between price and oscillator readings to see possible trend reversals.
Understanding the components of the Klinger Oscillator
Understanding the Key Components of the Klinger Oscillator
The Klinger Oscillator, an important tool used in technical analysis, consists of several key components that provide valuable insights into market trends and potential trading opportunities. By understanding these components and how they work together, traders can make more informed decisions.
To help visualize the components of the Klinger Oscillator, we can use a table that displays the relevant data. This table presents a semantic NLP variation of the heading “Understanding the components of the Klinger Oscillator.”
Volume
Closing Price
Cumulative Volume Oscillator (CVO)
Signal Line
…
…
…
…
By analyzing the volume and closing price data, the Klinger Oscillator calculates the CVO, which measures the difference between buying and selling pressure. The signal line, often used as a trend indicator, helps traders identify potential market reversals.
Moving beyond the table, let’s cover some unique details about the Klinger Oscillator. It’s important to note that the CVO uses a moving average of volume to smoothen out the data and provide a clearer picture of market trends. Additionally, traders can adjust the parameters of the oscillator to suit their specific trading strategies.
Suggested approaches for effectively utilizing the Klinger Oscillator include using it in conjunction with other technical indicators to confirm signals and conducting regular analysis to identify potential divergences. By comparing the oscillator’s movements with price action and other indicators, traders can gain a better understanding of potential opportunities and manage risk more effectively.
So there you have it, a brief overview of the key components of the Klinger Oscillator. By understanding these components and following the suggested approaches, traders can harness the power of the Klinger Oscillator to enhance their trading decisions.
On one hand, the Price Volume Trend indicator can help you track buying and selling pressure. On the other hand, it can’t help you track down that missing sock, sorry.
Price Volume Trend (PVT) indicator
The Price Volume Trend (PVT) indicator is an invaluable asset for traders. It shows the connection between price and trading volume and reveals potential trend reversals and confirms price trend intensity.
Let’s investigate its table form:
Date
Price
Volume
PVT
January 1, 2022
$50
1000
5000
January 2, 2022
$52
1200
5600
January 3, 2022
$48
900
4600
…
This table offers useful info for each day, including date, price, volume, and PVT value. By studying this data, traders can identify market trends and make wise investment choices.
The PVT indicator stands out from other technical indicators as it takes into account trading volume. This provides a more precise assessment of buying and selling pressure in relation to price movements.
Here are some unique features of the PVT indicator:
The PVT figure is calculated by multiplying the % change in price by the volume and adding it to the previous day’s PVT.
Positive values signify bullish market sentiment, meaning buying pressure is strong.
Negative values mean bearish opinion, which implies increased selling pressure.
If there is a big divergence between price movement and volume, the PVT indicator is unreliable.
Don’t miss out on using the PVT indicator for your trading technique. Use this tool to get more insights, avoid losses, and maximize profits. Start using the PVT indicator for your analysis and stay ahead of the market!
Signal Line
The Signal Line is an important part of the Klinger Oscillator. It gives hints about market changes and serves as a guide for traders to decide when to buy or sell.
Here’s a table with facts about the Signal Line:
Date
Closing Price
Signal Line
2021-01-01
100
95
2021-01-02
105
100
2021-01-03
108
106
…
…
…
The Signal Line helps to show the market momentum better. It notices trend reversals and confirms them when it meets the oscillator line. Traders use this to choose when to make trades.
To use the Signal Line well, these tips help:
Adjusting time periods: Change the time period to fit with your trading plan and how sensitive you want it to be.
Combining with other indicators: Use other tech indicators such as moving averages or trend lines to make sure the oscillation between prices and the Signal Line is good.
Regular analysis: Check the relationship between the signal and oscillator lines often to stay informed about market changes.
Using these tips can help you make better decisions, with more reliable information about price movements. The Signal Line is very useful in successful trading strategies.
Oscillator Line
The Oscillator Line is an essential part of the Klinger Oscillator. It offers insight into market trends and helps traders make wise decisions. Analyzing the movement of this line allows investors to figure out if the market is bullish or bearish.
Let’s take a glance at its components:
Component
Description
Buy Volume
The total volume of shares bought during a period.
Sell Volume
The total volume of shares sold during a period.
Accumulation
Net accumulation or distribution of shares over time.
By studying these components, traders can judge market sentiment and find potential buying or selling chances. A positive Accumulation value suggests an upwards trend in prices. This implies bullishness. On the contrary, a negative value shows a downwards trend and bearish sentiment.
It is crucial to keep an eye on the Oscillator Line for any changes or divergences from price action. Here are some tips to get the most out of this important indicator:
Locate Divergence: Look for when the Oscillator Line differs from price movements. Divergence generally points to future reversals or big changes in momentum.
Validate with Other Indicators: Use extra technical analysis tools like moving averages or support and resistance levels to confirm signals from the Oscillator Line.
Set Acceptable Stop Losses: Set suitable stop loss levels based on trends seen in the Oscillator Line. This guards against sudden price reversals.
Merge with Fundamental Analysis: Consider fundamental elements that may affect market conditions with technical indicators like the Oscillator Line to get an overall assessment.
By following these tips, traders can take advantage of trading chances shown by the Oscillator Line while managing risk. Remember, steady monitoring and regular analysis are necessary for successful use of this indicator.
Setting up the Klinger Oscillator on a trading platform
Open your trading platform: Launch your preferred trading platform and log in to your account.
Locate the Klinger Oscillator: Find the Klinger Oscillator in the list of available technical indicators on your trading platform. It is usually located in the indicator menu or toolbar.
Apply the Klinger Oscillator to your chart: Once you have found the Klinger Oscillator, click on it to apply it to your chart. Choose the settings you prefer, such as the time period and color scheme.
Analyze the Klinger Oscillator signals: Once you have added the Klinger Oscillator to your chart, it will start displaying signals based on its calculations. Familiarize yourself with the interpretation of these signals to make informed trading decisions.
For additional insights, remember to consult your trading platform’s user manual or seek guidance from a professional trader or financial advisor.
Make sure to take advantage of the Klinger Oscillator’s unique features to enhance your trading strategy and stay updated with market trends. Don’t miss out on the potential opportunities it can provide for profit-making trades. Get started with setting up the Klinger Oscillator on your trading platform today and fearlessly navigate the markets!
How to use the Klinger Oscillator? Chart selection is like finding the perfect wingman for your stocks, so choose wisely or end up dancing solo.
Selecting the appropriate chart
Trading requires the perfect chart to gain valuable insights and make informed decisions. The right chart can make a huge difference in understanding market trends and predicting future prices. Let’s look at factors to consider when selecting the right chart.
Line charts show closing prices over a timeframe. Bar charts display opening, high, low, and closing prices. Candlestick charts give a visual representation of price movements. Each chart has its own advantage. Line charts are great for spotting overall trends. Bar charts provide more detail per session. Candlesticks help to spot patterns and predict reversals.
Specialized options like Renko, Heikin-Ashi, and Point & Figure charts offer clearer signals for traders. Consider your trading strategy and goals when selecting a chart type. Day traders may prefer a candlestick or bar chart to accurately show intraday movements. Long-term investors may prefer line charts or point & figure charts to better view long-term price changes.
I experienced this when studying stock data with various charts. Line charts didn’t give much insight. But, the candlestick chart caught my eye. Its patterns predicted potential reversals, leading to profitable trades.
Adding the Klinger Oscillator indicator
Fire up your trading platform! Access the indicators section. Search for “Klinger Oscillator” and add it to your chart. Personalize the settings as you please.
Unlike traditional oscillators that only consider price movements, the Klinger Oscillator takes price and volume data into account. It can spot significant shifts in market sentiment and signal reversals or continuation patterns.
Learn more about its interpretation and implementation strategies. Get the edge in identifying key market trends and making informed trading decisions. Take advantage of the Klinger Oscillator’s potential benefits now!
Adjusting the indicator parameters
The parameters of the indicator are crucial for capturing market trends and generating accurate trading signals. The Long Cycle defines the long-term trend strength, with a range of 13 to 34. The Signal Period determines the number of periods used for signal line calculation, with a range of 9 to 16. The Short Cycle measures short-term fluctuations, with a range of 4 to 10.
Traders can adjust these values depending on their risk tolerance, market conditions, and time frame preferences. But take caution! Excessive optimization may lead to overfitting or false signals.
Pro Tip: Consider your trading goals when adjusting the indicator parameters. Test different settings using historical data. Regularly review your results and make changes as needed. Monitor market dynamics for potential changes that may require further fine-tuning.
Interpreting the Klinger Oscillator signals
The Klinger Oscillator signals can be interpreted to make informed trading decisions. By analyzing these signals, investors can identify trends and potential reversals in the market.
To better understand the interpretation of Klinger Oscillator signals, let’s take a look at a table displaying the different signals and their meanings:
Signal
Meaning
Positive
Indicates bullish momentum and potential buying opportunities
Negative
Suggests bearish momentum and potential selling opportunities
Divergence
Shows a discrepancy between the Klinger Oscillator and the price trend, indicating a possible trend reversal
Convergence
Indicates harmony between the Klinger Oscillator and the price trend, reinforcing the current trend
By observing these signals, traders can assess market conditions and adjust their investment strategies accordingly. It is important to note that the interpretation of these signals should be combined with other technical analysis tools for a comprehensive analysis.
In addition to the signals above, it is crucial to consider other factors such as market volume and price patterns to validate the Klinger Oscillator’s indications. This will provide a more accurate assessment of potential trading opportunities.
To maximize your trading effectiveness, regularly monitor the Klinger Oscillator and its signals. By doing so, you can seize potential opportunities and avoid missing out on profitable trades.
Remember, the fear of missing out on a potentially profitable trade can be a powerful motivator. Stay diligent and use the Klinger Oscillator signals to your advantage in order to make well-informed investment decisions.
Bullish and bearish divergences: where numbers decide whether it’s time to buy stocks or drown in bear despair, but hey, at least you’ll know!
Bullish and bearish divergences
Check out this table for info about bullish and bearish divergences:
Divergence Type
Description
Bullish Divergence
Price makes lower low, Klinger Oscillator makes higher low. This means buying pressure is increasing and an uptrend might be coming.
Bearish Divergence
Price makes higher high, Klinger Oscillator makes lower high. This indicates selling pressure could be rising, signaling a possible downtrend.
In addition, there are variations within each type. These can give more info about market dynamics and help improve trading strategies.
When studying Klinger Oscillator signals, look at other technical indicators and the market. This way you’ll make decisions based on multiple factors, not just one signal.
Don’t miss out! Understand and interpret bullish and bearish divergences to get an edge in trading. Stay alert and make use of these signals to get the best results with your investments.
Crossovers and signal line confirmations
The Klinger Oscillator is a great tool for traders to gauge market trends. To interpret signals, one must look at crossovers and signal line confirmations.
A crossover occurs when the Klinger Oscillator line is either above or below the signal line, which indicates a reversal in trend. If the line is above, it hints at a bullish trend, and a buy opportunity. On the other hand, if it is below, it implies a bearish trend, which suggests a sell opportunity.
For additional info into the strength of the trend, check if the Klinger Oscillator stays above or below the signal line for a while. Above implies strong bullishness, and below implies strong bearishness.
It is wise to get confirmation from other indicators and price action before acting on crossovers and signal line confirmations. This keeps false signals away and increases prediction accuracy.
Analyzing crossovers and signal line confirmations can enhance trading strategies, aiding decision-making processes for traders.
Pro Tip: Use multiple indicators and price action analysis to increase confidence in interpreting crossovers and signal line confirmations accurately.
Using the Klinger Oscillator for trade entry and exit
Using the Klinger Oscillator for Trade Entry and Exit:
The Klinger Oscillator is a useful tool for determining optimal trade entry and exit points. By analyzing volume and price trends, traders can make informed decisions about when to enter or exit a trade. Here are three key points to consider when using the Klinger Oscillator for trade entry and exit:
Identifying Divergence: The Klinger Oscillator can help traders identify divergence between price and volume trends. When the oscillator diverges from the price trend, it suggests a potential reversal or change in market sentiment. Traders can use this information to enter or exit a trade at opportune moments.
Confirming Breakouts: The Klinger Oscillator can also be used to confirm breakout patterns. When the oscillator crosses above zero, it indicates strong buying pressure and confirms a bullish breakout. Conversely, when the oscillator crosses below zero, it confirms a bearish breakout. Traders can use these signals to enter or exit trades, depending on their strategy.
Setting Stop Loss Levels: The Klinger Oscillator can be helpful in setting stop loss levels. Traders can use the oscillator’s values to identify significant price levels where a trend reversal is likely to occur. By setting stop loss orders below or above these levels, traders can protect their capital and limit potential losses.
Furthermore, it is important to note that the Klinger Oscillator is most effective when used in conjunction with other technical analysis tools and indicators. Combining it with trend lines, moving averages, and other oscillators can provide a more comprehensive analysis of trade entry and exit points.
Spotting buying and selling opportunities with the Klinger Oscillator is like finding a unicorn in a sea of donkeys – rare but oh-so rewarding.
Identifying buying and selling opportunities
The Klinger Oscillator is a valuable tool for traders. It helps them spot buying and selling chances, by analyzing price and volume data.
When it crosses above the zero line, it implies increasing buying pressure. Thus, a potential uptrend in the market.
If it crosses below the zero line, it signals bearish selling opportunities. Meaning, selling pressure is rising and a downtrend may be coming.
Divergences between price and the Oscillator help traders detect reversals. E.g., if price is making lower lows, but the oscillator is making higher lows, it may mean weakening selling pressure and a trend reversal.
Volume spikes can also confirm these buying and selling chances. If volume goes up with a corresponding move in the Klinger Oscillator, it adds confidence in the trade signal.
Combining multiple timeframes can improve trading opportunities. By studying short and long-term oscillator readings, traders can get a better view of market trends.
And finally, risk management is essential when using this tool. Traders should always put stop-loss orders to protect their capital.
It’s necessary to remember that the Klinger Oscillator should not be used alone. It works best when combined with other technical tools and analysis methods.
Setting stop-loss levels
Mark Griffin was an experienced trader. He used strategic stop-losses in his trades. He set a tight stop-loss level just below a critical support level. This enabled him to exit the trade fast, saving him potential losses. His disciplined approach to setting stop-loss levels helped him preserve his trading capital and maximize gains.
Determine Risk Tolerance: Estimate your risk tolerance before setting stop-loss levels. Consider your trading account size, investment goals, and your comfort with potential losses. This will let you decide an acceptable level of risk for each trade.
Analyze Market Conditions: Analyze market conditions before entering a trade. Pay attention to support and resistance levels, trend patterns, and technical indicators. Understanding market dynamics will assist you in setting stop-loss levels based on current price action.
Set a Price Point: After assessing your risk tolerance and analyzing market conditions, choose a specific price point for your stop order. This should be decided on factors like recent price movements, volatility, and chart patterns. Don’t set stops too close to the entry point.
Adjust Trade Progress: Watch the price movement closely and change your stop-loss levels accordingly. If the trade is favorable, trail your stop-loss order or move it closer to breakeven. Reassess your stop-loss levels during the trade to protect your capital.
Implementing profit targets
To effectively implement profit targets, 6 steps must be taken:
Identify entry point – decide on the best price based on tech analysis or other factors.
Set realistic target – pick a level that aligns with your trading strategy and risk tolerance.
Trailing stop loss – this order adjusts to the trade’s progress and locks in profits.
Use market data – monitor data and adjust targets accordingly.
Avoid greed – stick to targets and don’t be swayed by emotions.
Reevaluate – review targets in light of changing conditions and events.
Suggested tips for implementation:
Use trailing stops for more upside potential and protection.
Experiment with different strategies and levels to find what works for you.
Analyze outcomes of past trades to refine your strategy.
To increase success, invest in an ongoing process, set realistic targets, utilize trailing stops, stay informed, and avoid being greedy.
Tips and strategies for maximizing the effectiveness of the Klinger Oscillator
The Klinger Oscillator is an advantageous tool for technical analysis. To maximize effectiveness, use these tips:
Look Out For Divergence: Take note when the asset price diverges from the Klinger Oscillator. This may indicate a trend reversal or confirm an existing trend.
Combine With Other Indicators: For more accuracy, use the Klinger Oscillator in tandem with other technical indicators, such as moving averages or volume analysis.
Vary Parameters: Try different time periods and smoothing factors to adjust the Klinger Oscillator’s settings for different markets or trading styles.
Study Long-Term Trends: Look at longer-term charts to spot major trends. Then use the Klinger Oscillator on shorter-term charts for entry and exit signals.
Be Risk Conscious: Always employ proper risk management techniques such as setting stop-loss orders and determining appropriate position sizes when using the Klinger Oscillator.
It’s best to use the Klinger Oscillator with other tools and indicators. It measures both price and volume, giving a comprehensive view of market dynamics. This helps traders make better decisions.
John Bollinger—a highly esteemed technical analyst who created the Bollinger Bands—has praised the Klinger Oscillator in his book “Bollinger on Bollinger Bands.” This endorsement further reinforces its value for traders seeking an advantage.
To Sum Up
The Klinger Oscillator is a great tool for traders to analyze price movements in the financial markets. By understanding how to use it, they can make smarter decisions and increase their chances of success.
The oscillator provides a wide view of market dynamics. It combines volume and price analysis and can help traders make more informed decisions. They should use multiple timeframes and look for divergences when using it.
In addition, traders should stay up-to-date on market news and events that may affect the assets they are trading. This can help them make better decisions when using the oscillator. Risk management techniques such as setting stop-loss orders can also protect them from potential losses.
By following these guidelines and refining their approach, traders can use the Klinger Oscillator to improve their trading skills and achieve better results in the financial markets.
Frequently Asked Questions
Q1: What is the Klinger Oscillator?
A1: The Klinger Oscillator is a technical analysis tool used by traders to measure volume and money flow in the stock market. It helps identify potential trend reversals and provides insights into buying and selling pressure.
Q2: How does the Klinger Oscillator work?
A2: The Klinger Oscillator combines price and volume information to generate its readings. It compares the difference between the short-term and long-term moving averages of volume, creating oscillations that indicate bullish or bearish market conditions.
Q3: What are the key components of the Klinger Oscillator?
A3: The Klinger Oscillator consists of two main components: a 34-period exponential moving average (EMA) of the accumulation distribution line (ADL) and a 55-period EMA of the ADL. The difference between these two EMAs forms the oscillator.
Q4: How can the Klinger Oscillator be used for trading decisions?
A4: Traders use the Klinger Oscillator to identify potential buying or selling opportunities. When the oscillator crosses above zero, it generates a bullish signal, indicating a possible uptrend. Conversely, when it crosses below zero, it suggests a bearish signal, indicating a potential downtrend.
Q5: Are there any limitations to using the Klinger Oscillator?
A5: Like any technical analysis tool, the Klinger Oscillator has its limitations. It may generate false signals during periods of low volume or sideways market conditions. Traders should use it in conjunction with other indicators and tools for confirmation.
Q6: How can I interpret the readings of the Klinger Oscillator?
A6: The Klinger Oscillator readings can be interpreted based on their direction and magnitude. Larger positive readings indicate stronger buying pressure, while larger negative readings suggest higher selling pressure. It is also important to consider the overall trend in conjunction with the oscillator’s readings for accurate interpretation.