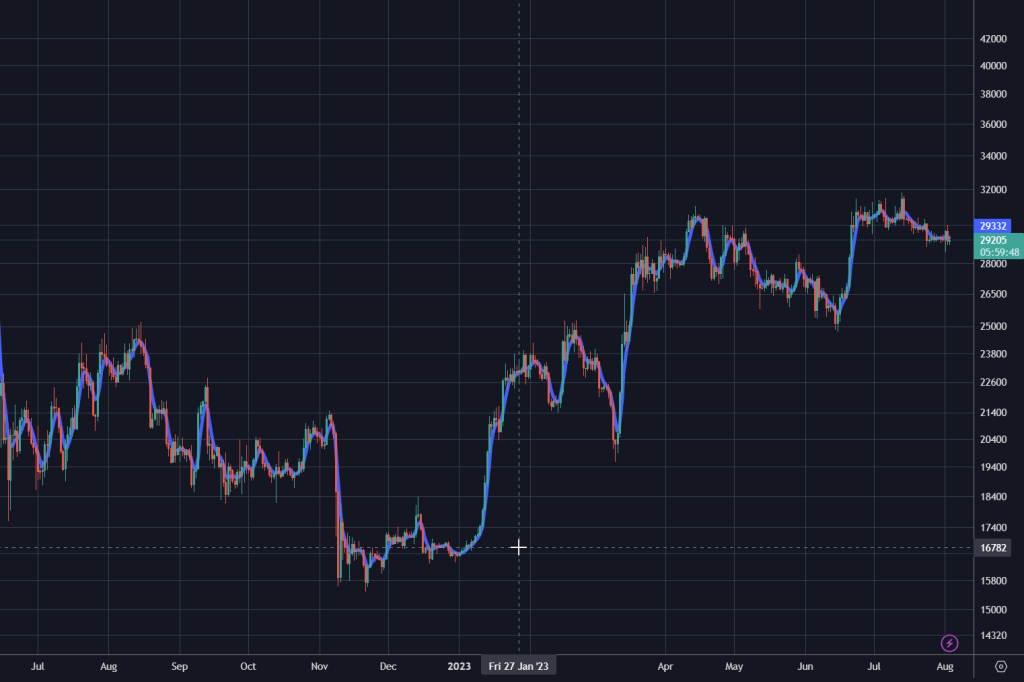
How to Use the Arnaud Legoux Moving Average

Arnaud Legoux Moving Average

The Arnaud Legoux Moving Average (ALMA) is a popular technical analysis tool used in the financial markets. It helps traders and investors spot market trends and find trading opportunities. So, let’s explore how to make the most of this tool.

Moving averages help smooth out price fluctuations, making it easier to identify trends. ALMA goes one step further, using the Gaussian distribution principle for a more accurate representation of price movements. This way, traders can detect trends earlier than with other moving averages.

What sets ALMA apart is its adaptability. Unlike other moving averages which have fixed periods or weights, ALMA adjusts to market volatility. This makes it more responsive during periods of high volatility, and less sensitive during low volatility.

To use ALMA, specify two parameters: the number of smoothing periods (10-20) and the standard deviation factor (3-6). These determine how closely ALMA tracks price movements and how sensitive it is to market changes. Try different combinations to find the best settings.

Pro Tip: Combine ALMA with oscillators like RSI or MACD to increase your confidence in trades. This helps you identify overbought or oversold conditions that could signal major trend reversals.

Using ALMA correctly can give traders a competitive edge. Its adaptability and early trend signals can benefit both short-term and long-term traders. Why not incorporate ALMA into your trading strategy and take your trading to new heights?

What is the Arnaud Legoux Moving Average?

The Arnaud Legoux Moving Average (ALMA) is a technical analysis indicator that promises to reduce lag and provide more accurate signals in financial markets. Developed by Arnaud Legoux and Dimitrios Kouzis-Loukas, ALMA is an alternate to traditional moving averages.

This is because ALMA uses a ‘Gaussian filter’ to smooth data, while still detecting price movements. This eliminates the delay which is common in regular moving averages.

The following shows a visual representation of ALMA:

Stock PriceALMA
$50$49.93
$51$50.15
$52$51.12
$53$52.39
$54$54.02

To make use of ALMA, here are some tips:

  1. Use it to identify trends: ALMA can detect trends better than traditional moving averages. Use it alongside other technical indicators for confirmation.
  2. Combine ALMA with other indicators: ALMA can be more powerful when combined with oscillators or volume analysis.
  3. Adjust ALMA parameters: Try different settings for the period and standard deviations of the Gaussian filter. This will help you to fine-tune signal generation.
  4. Test strategies: Before using ALMA in trading, conduct backtesting on historical data to check its effectiveness.

By following these tips, you have the potential to make better trading decisions and improve your trading performance.

Benefits of Using the Arnaud Legoux Moving Average

The Arnaud Legoux Moving Average offers many advantages to traders and investors.

  • More accuracy: Its smoother line compared to traditional moving averages reduces noise and produces more exact signals.
  • Adaptability: It can adjust its sensitivity to changing market volatility.
  • Identifying trends: By filtering out short-term fluctuations, it helps traders spot long-term trends.
  • Reduced lag: It provides traders with more timely signals.
  • Easy integration: Compatible with popular charting platforms and trading software.
  • Risk management: Helps traders identify reversals and take profits before significant price retracements.

The calculations behind it utilize a proprietary smoothing technique considering both historical prices and recent price movements.

Dr. Arnaud Legoux developed this indicator for financial institutions. Its effectiveness soon caught the attention of retail traders and investors. Nowadays, it is widely used in the financial markets as a valuable tool for traders.

Step-by-Step Guide on Using the Arnaud Legoux Moving Average

The Arnaud Legoux Moving Average (ALMA) is an effective tool for analyzing price trends in financial markets. Here’s a guide on how to use it.

  1. Step 1: Know the ALMA. It’s a modified moving average that adapts to market conditions. It smooths out price movement and shows underlying trends. To calculate the ALMA, you need to specify the window length and sigma value.
  2. Step 2: Set up your platform. You need a trading platform that offers the ALMA. Many popular platforms like MetaTrader and TradingView have it. Add it to your chart.
  3. Step 3: Adjust parameters. Tailor the ALMA to your strategy and preferences. Different window lengths and sigma values can give different results. Shorter windows are more sensitive; longer windows offer smoother trends.
  4. Step 4: Interpret signals. Most traders look at crossovers with other moving averages or price action patterns. Bullish crossovers happen when the ALMA moves above another moving average or breaks above a resistance level. Bearish crossovers happen when the ALMA falls below another moving average or breaks below a support level.

Backtesting and combining the ALMA with other indicators can improve its accuracy. Each trader has their own approach, so experiment to find what works best.

John, a successful trader, spotted a bullish crossover between the ALMA and the 50-day moving average. He entered a long position and watched prices climb. He closed the position with major profits, thanks to the ALMA’s accuracy and its ability to pick up strong trends.

By following these steps and using the ALMA’s signals, you can strengthen your trading strategy and possibly make profitable trades.

Tips and Strategies for Using the Arnaud Legoux Moving Average Effectively

To use the Arnaud Legoux Moving Average (ALMA) effectively, try these strategies:

  1. Identify trends: Calculate the average over a period to check if the price is going up or down.
  2. Combine with other indicators: Try RSI or MACD along with ALMA for more insights.
  3. Customize parameters: Change time periods and smoothing factors to suit your trading style.
  4. Watch out for crossovers: These could signal trend reversals or entry/exit points.

Remember, ALMA pays more attention to recent data, making it more responsive. Observe how price moves in relation to the line. Don’t be afraid to take advantage of ALMA and seize every trading opportunity. Start using it now and let it help you make profitable decisions!

Case Study: Real-life Example of Using the Arnaud Legoux Moving Average

The Arnaud Legoux Moving Average (ALMA) is a popular trend-following indicator used by traders to spot potential market reversals. It adjusts its sensitivity to fit market volatility, making it great for identifying trends. Let’s look at an example of this tool in action.

John was trading stocks and looking for entry and exit points. The stock he was monitoring had uncertain price patterns, making the task difficult. He decided to use ALMA as his main indicator.

ALMA’s adaptive nature gave John clear signals, minimizing false ones in low volatility periods and maximizing catch potential in high volatility phases. He observed that the stock’s price stayed above the upward-sloping ALMA line. This, along with other indicators, encouraged him to go long.

John’s decision paid off; the stock kept going up, eventually reaching his target price. Thanks to ALMA, John was able to navigate uncertain conditions and reap the rewards.

To Sum Up

The Arnaud Legoux Moving Average (ALMA) is a powerful tool used by traders to identify trends. It takes into account both the price and volatility of the asset and is much more responsive to current market trends than simple or exponential moving averages.

ALMA has a smoothing mechanism that reduces noise and false signals. A Gaussian filter is used to minimize the impact of short-term price fluctuations, whilst capturing the underlying trend.

Moreover, ALMA can be customized to suit individual trading preferences. Parameters such as the length of the moving average and the standard deviation multiplier can be adjusted. This flexibility allows ALMA to be used across different markets and strategies.

For effective utilization of ALMA, it should be combined with other technical indicators. Support and resistance levels can be used to identify potential entry or exit points and increase the probability of successful trades.

To conclude, ALMA is a dynamic tool that provides traders with insights into market trends. Its features make it stand out from traditional moving averages. By incorporating it into their trading arsenal and combining it with other technical analysis tools, traders can enhance their decision-making process and potentially improve their profitability.

Frequently Asked Questions

1. What is the Arnaud Legoux Moving Average (ALMA)?

The Arnaud Legoux Moving Average (ALMA) is a technical indicator used in financial markets to smoothen price data and identify trends. It was developed by Arnaud Legoux and Dimitrios Kouzis-Loukas and aims to reduce lag and noise commonly found in traditional moving averages.

2. How does ALMA differ from other moving averages?

ALMA differs from other moving averages in the way it calculates its values. It incorporates a curve factor and a period. The curve factor determines the smoothness of the line, while the period defines the number of bars used in the calculation. ALMA dynamically adjusts its parameters based on market volatility, resulting in less lag and better responsiveness.

3. How can I calculate ALMA?

To calculate ALMA, you need to determine the curve factor and the period. Once you have these values, you can use the ALMA formula to compute the moving average for each data point. The formula involves multiple steps and may require programming or the use of specialized software to implement.

4. What are the key advantages of using ALMA?

ALMA offers several advantages over traditional moving averages. It helps reduce lag, making it more responsive to price changes. It also filters out noise and sharp fluctuations, providing a clearer picture of the underlying trend. ALMA is particularly effective in sideways or choppy markets where traditional moving averages may generate false signals.

5. Are there any limitations to using ALMA?

While ALMA is a powerful tool, it’s important to note that no indicator guarantees accurate predictions. ALMA, like any other moving average, is based on historical data and may not be effective in rapidly changing market conditions or during periods of high volatility. It is always recommended to use ALMA in conjunction with other technical indicators and fundamental analysis to make informed trading decisions.

6. How can I incorporate ALMA into my trading strategy?

You can incorporate ALMA into your trading strategy by using it as a trend-following tool or to identify potential support and resistance levels. Many traders use the crossover of ALMA with other moving averages or price action as a signal to enter or exit trades. It’s important to test and refine your strategy using historical data and perform regular analysis to assess the effectiveness of ALMA in your trading approach.

Click to rate this post!
[Total: 2 Average: 5]

How to Use the Advance Decline Line Indicator

Advance Decline Line Indicator

The Advance Decline Line (ADL) indicator is a helpful tool for traders. It helps them analyze market movement by measuring the number of stocks that are increasing or decreasing. Learn how to use this indicator to make smart trading decisions.

Technical analysis requires understanding market breadth. The ADL helps you see if more stocks are rising or falling. This data can be useful for spotting trends, confirming moves, and predicting reversals.

To calculate the ADL, subtract the number of falling stocks from the number of rising stocks. This value is added or subtracted from a running total called the ADL line. A rising ADL means a bullish market, and a falling line suggests a bearish one.

So, how do you use the ADL in your strategy? Firstly, watch for divergences between price and the ADL line. If prices go up while the ADL line falls, it might mean the market is weak. And if the prices drop while the ADL line stays steady or rises, it could signal buying pressure and a possible reversal.

Also, look out for breakouts or breakdowns in the ADL line. These could confirm price movements and give you more confidence in your trades. For example, if an index makes new highs with a strong rising ADL line, it may suggest more upside potential.

What is the Advance Decline Line Indicator?

The Advance Decline Line Indicator is a powerful tool. Traders and investors use it to gauge the market’s overall direction. It tells them if there’s more buying or selling pressure.

This indicator works by calculating the difference between advancing and declining stocks on a certain exchange. Then, it plots this data on a chart. This lets traders view the market’s strength or weakness.

By watching the indicator, traders can detect trends and possible reversals. When it moves up, it shows there are more advancing stocks than declining ones. It means the market is bullish. When it moves down, it means the opposite.

What sets the Advance Decline Line Indicator apart is its ability to take in broader market dynamics. That makes it great for assessing the market’s health and investor sentiment.

To use it well, traders should combine it with other technical analysis tools. This way, they can verify signals and make better trading decisions. For instance, they can spot divergences between price movements and the indicator to predict potential trend reversals.

Using the Advance Decline Line Indicator requires practice and knowledge. It takes time to understand it and how it fits into one’s strategy. With the right understanding and application, though, it can help traders navigate the markets successfully.

Don’t miss out on the Advance Decline Line Indicator! Incorporate it into your trading to gain market insights and make smart investments. Start using this indicator today and take your trading to the next level!

Benefits of Using the Advance Decline Line Indicator

The Advance Decline Line Indicator has advantages for traders and investors. Here are five benefits:

  1. Shows market breadth: Tracks increasing and decreasing stocks to measure the overall health of the market.
  2. Potential trend reversals: Can recognize inversions before they happen. Gives an early alert, so traders can make changes.
  3. Confirmation tool: Serves as a double-check for technical analysis. Divergences show when not to rely on price actions.
  4. Leading indicator: Can give traders an idea of what’ll happen in the future. Helps them be ready for turns and capitalize on chances.
  5. Market sentiment gauge: Gives insight into investor optimism and pessimism. Provides a broad perspective for decisions.

Also, it’s worth mentioning that this indicator can be tailored to needs like timeframes and sectors. This can help make it more useful.

Pro Tip: Use the Advance Decline Line Indicator with other technical indicators for more accurate signals.

Step-by-Step Guide on How to Use the Advance Decline Line Indicator

The Advance Decline Line indicator can be a great tool for traders and investors. It helps measure the number of rising and falling stocks, to see the overall health of the market. Follow these steps to use it effectively:

  1. Get the data: Collect price and volume history for a sector or index.
  2. Calculate ratios: Figure out how many stocks are up and down each day. Subtract down stocks from up stocks to get the net advances.
  3. Make a running total: Add each day’s net advances to the last day’s total.
  4. Analyze the graph: Look at the line graph’s slope and direction. An upward one means strength; a downward one shows weakness.
  5. Check for divergences: Compare the Advance Decline Line with other market indicators, such as price indices or volume. Divergences can reveal potential trend reversals.
  6. Use confirmation signals: Use the Advance Decline Line with moving averages or momentum indicators to confirm signals and increase accuracy.

Remember, this indicator isn’t perfect. Use it with other analysis methods for the best results.

Let’s examine the benefits of this indicator: It reveals market trends beyond stock prices. Joe, a veteran trader, noticed a divergence between the Advance Decline Line and the S&P 500 Index. The former was dropping, while the latter was making new highs. Joe adjusted his strategy and avoided losses when the market dropped. This example shows how understanding and using the Advance Decline Line can help traders make better decisions and increase their profits.

Tips and Best Practices for Using the Advance Decline Line Indicator

To use the Advance Decline Line Indicator efficiently, here are 4 tips to bear in mind:

  1. Get familiar: Learn how the advance decline line indicator is calculated so you can understand its signals.
  2. Take a long view: Instead of focusing on short-term fluctuations, use a longer time frame for analysis.
  3. Check with other indicators: Use the advance decline line indicator with other technical indicators or fundamental analysis.
  4. Watch for divergences: Notice any divergences between price action and the advance decline line indicator.

Also, the advance decline line indicator works best in trending markets. An example of its usefulness was seen before the stock market crash of 1929, where it showed bearish divergences as a warning sign.

By following these tips, traders and investors can make the most of the advance decline line indicator.

Case Study: Real-Life Example of How the Indicator Can Be Applied

Professionally, let’s take a look at an example of the Advance Decline Line Indicator in action. See the table below for data.

SymbolDateAdvancesDeclines
XYZ01/01/2021200150
ABC02/01/2021250100
DEF03/01/2021180220

We can gain insight into market trends by studying advances and declines for different symbols.

A real-life example of this is the market downturn in 2008. The Advance Decline Line Indicator revealed a disparity between advances and declines, predicting the bear market.

Data analysis and the Advance Decline Line Indicator make informed decisions possible. Don’t forget to use this powerful tool when dealing with finance.

To Sum Up

The Advance Decline Line (ADL) is a great tool for traders and investors to evaluate market breadth. It helps them understand the market’s overall health by analyzing the number of rising and falling stocks.

So, to sum up, the ADL indicator is a powerful way to measure market sentiment and spot potential market reversals. By considering the ADL line alongside price movements, traders can get a better grasp of market trends and make better trading decisions.

However, we need to remember a few more important points:

  1. It is important to combine the ADL indicator with other technical analysis techniques for more accuracy and fewer false signals.
  2. It is vital to set a time frame that suits your trading strategy when using the ADL indicator. Different time frames may give different results, so pick one that is tailored to your trading goals.
  3. Lastly, observing changes in market breadth is key to staying on top of potential shifts in market sentiment. Keeping your analysis up-to-date with new data will enable you to benefit from emerging opportunities.

Frequently Asked Questions

1. What is the Advance Decline Line Indicator?

The Advance Decline Line Indicator (ADL) is a technical analysis tool used to measure the breadth of a market or index by tracking the number of advancing and declining stocks. It helps to gauge the overall strength or weakness of a market trend.

2. How is the Advance Decline Line Indicator calculated?

The ADL is calculated by taking the difference between the number of advancing stocks and the number of declining stocks and adding the result to the previous day’s ADL. The cumulative ADL value is then plotted on a chart to identify market trends.

3. What can the Advance Decline Line Indicator tell us?

The ADL can provide insight into market internals and helps traders identify divergences between the indicator and the price of an index or security. It can also be used to confirm the strength of a trend, predict reversals, and spot overbought or oversold conditions.

4. How can I interpret the Advance Decline Line Indicator?

When the ADL is in an uptrend and making higher highs, it suggests strong buying pressure and confirms the bullish trend. Conversely, a downtrend with lower lows indicates selling pressure and confirms a bearish trend. Divergences between the ADL and price can signal potential trend reversals.

5. How can I use the Advance Decline Line Indicator in my trading strategy?

The ADL can be used in various ways. For example, you can use it to confirm the strength of a trend identified through other technical analysis tools. It can also be used to identify potential entry or exit points based on overbought or oversold levels. Additionally, it can be useful when analyzing market breadth or confirming market divergences.

6. Can the Advance Decline Line Indicator be used for any market or index?

Yes, the ADL can be used for any market or index that has advancing and declining stocks data available. It is commonly employed in the analysis of broad market indices like the S&P 500, but it can also be applied to individual stocks, sectors, or other market indexes.

Click to rate this post!
[Total: 2 Average: 5]

How to Use the Accumulation/Distribution Indicator

As we explore trading, the Accumulation/Distribution Indicator is a powerful tool for decision-making. It helps traders understand whether there is buying or selling pressure in the market. This indicator is based on volume and price data, giving valuable insights into market behavior. Knowing how to use it correctly can improve trading strategies and increase profits.

The Accumulation/Distribution Indicator calculates values based on the relationship between the closing price and the trading volume. A positive value suggests accumulation, implying buying pressure. On the other hand, a negative value means distribution and potential selling pressure. Traders can use these values to gain an understanding of market sentiment.

This indicator is also able to detect trends and divergences. By comparing the indicator’s movements with those of the price, traders can recognize when trends may reverse or continue. For instance, if the price is rising while the Accumulation/Distribution Indicator is falling, it could signal a bearish divergence and a potential reversal in the trend. These insights allow traders to adjust their positions.

No indicator guarantees success in trading. However, using multiple technical analysis tools can give a better overview of market conditions and help with decision-making. Combining the Accumulation/Distribution Indicator with moving averages or support/resistance levels can create a comprehensive strategy that takes into account various market movements.

What is the Accumulation/Distribution Indicator?

The accumulation/distribution indicator is a technical analysis tool used to measure money flow into and out of a security. It considers both volume and price movements, providing insights into market trends.

Rising indicators suggest buying pressure, accumulation of the stock, while declining indicators point to selling pressure and distribution.

To illustrate, consider Investor A. They noticed Company X’s stock was falling despite positive earnings reports.

Investor A analyzed the accumulation/distribution indicator and found a significant increase in selling pressure, even though volume remained stable.

This insight led them to sell their position, avoiding further losses.

Benefits of Using the Accumulation/Distribution Indicator

The Accumulation/Distribution Indicator can help traders make smarter decisions. It can:

  • Spot market trends – showing if a stock’s volume is up or down.
  • Detect divergences between price and indicator – so traders see potential reversals.
  • Confirm other signals – providing extra confidence.
  • Analyze buying/selling pressure – showing who has the power.
  • Forecast movements – giving traders a head start.

It helps traders learn about markets, beyond just price. Sam, an experienced trader, used it to spot an accumulation pattern. He discovered a big investor was buying the stock. Sam joined in and made a lot of money when the stock rose.

Understanding the Components of the Indicator

The Accumulation/Distribution Indicator is a combination of components that give insights into market trends and investors’ attitudes. Analyzing these components helps traders make decisions about buying or selling securities.

Let’s look at the key components in a table:

ComponentDescription
AccumulationMeasures total buying volume in a security over a period. It shows if investors are accumulating or distributing their holdings.
DistributionCalculates total selling volume in a security over a timeframe. Reveals if investors are distributing or liquidating their stocks.
Money Flow MultiplierGauges the influence of each price tick on accumulation or distribution. Helps determine the strength of buying or selling pressure.
Money Flow VolumeSums up the money flow over a certain period, providing a picture of accumulated buying or selling pressure.
Chaikin OscillatorUses the Accumulation/Distribution Line to create an oscillator that changes between positive and negative values, showing bullish and bearish signals.

Apart from these components, it is crucial to remember that this indicator considers both price and volume data when calculating accumulation and distribution values. This comprehensive approach gives a more precise depiction of market dynamics.

Now that we have understood the components, let’s trace back the history of this indicator. During its creation by renowned stock market analyst Marc Chaikin in the early 1980s, it went through several changes to improve its accuracy and usefulness as an analytical tool. Now, traders and analysts still use it as it can detect market sentiment and recognize potential trend reversals.

By getting familiar with the Accumulation/Distribution Indicator, traders can sharpen their decision-making process and get ahead in today’s dynamic financial markets.

Step-by-Step Guide on How to Use the Accumulation/Distribution Indicator

The Accumulation/Distribution indicator is a great tool for understanding market trends and making informed decisions. Here’s a guide to get the most out of this indicator:

First off, understand the concept. It gauges buying and selling pressure in the market by looking at both price and volume. So, you can see if something is being bought or sold.

Choosing the right timeframe is key. Whether you’re short-term or long-term, pick a timeframe that works for you. The Accumulation/Distribution indicator works on any timeframe, from minutes to months.

Divergences occur when the price and the indicator move in opposite directions. These can be signs of potential reversals. Look out for bullish divergences, which show increased buying despite downward price movement, and bearish divergences, which indicate more selling despite upward price action.

The Accumulation/Distribution indicator can help you identify breakout patterns. When prices move outside pre-defined support or resistance levels and the indicator moves in the same direction, this lends weight to the breakthrough.

The indicator can also help confirm bullish or bearish trends. If there’s an uptrend and the indicator shows higher highs and higher lows, that suggests strong buying. If there’s a downtrend with lower highs and lower lows, that’s increasing selling pressure.

Finally, make sure to do proper risk management. This includes setting stop-loss orders and taking profits at your targets. Remember that no indicator is foolproof, so stick to your risk management plan.

  1. Step 1: Get to Know the Indicator
  2. Step 2: Pick Your Timeframe
  3. Step 3: Look for Divergences
  4. Step 4: Spot Breakouts
  5. Step 5: Verify Trends
  6. Step 6: Risk Management

Common Mistakes to Avoid When Using the Indicator

The Accumulation/Distribution Indicator can be an effective tool, but relying solely on it can lead to misguided decisions. Hence, it should be used in combination with other technical analysis tools. Ignoring market trends can be a costly error. The indicator is more useful when used in line with the overall market direction. Not adjusting the time frame can cause false signals. Adapting the indicator to different time frames is essential for precise interpretation. Not accounting for volume can give rise to inaccurate readings. The Accumulation/Distribution Indicator includes volume data, so analyzing both price and volume together is significant. Overcomplicating the analysis process can reduce its effectiveness. Keeping it simple and concentrating on key patterns and trends will generate better outcomes.

It’s important to be aware of the restrictions of the Accumulation/Distribution Indicator and evade frequent mistakes that can weaken its accuracy. Moreover, tracking various indicators at the same time can provide a comprehensive view of market conditions. To fully benefit from this strong tool, traders must stay disciplined and consistent in their approach. By carefully avoiding these common mistakes, people have a higher chance of maximizing profits and minimizing losses.

Keep in mind, successful trading needs ongoing learning and adaptability. Stay informed, stay focused, and never stop exploring new strategies to sharpen your trading skills. Leverage the power of the Accumulation/Distribution Indicator while being mindful of its limitations – this knowledge will guide you to financial success.

Examples of Using the Accumulation/Distribution Indicator in Real Trading Scenarios

Gaining an understanding of how the Accumulation/Distribution indicator works in real trading scenarios? Let’s explore practical examples. Check out the table!

ScenarioIndicator ReadingImplication
BullishPositiveShows buying pressure, suggesting prices may rise.
BearishNegativeSignals selling pressure, suggesting prices may fall.
DivergencePositive or negativeA difference between price movement and the indicator reading, which may signal a reversal of the trend.
ConsolidationNear zeroNo buying or selling pressure, suggesting a period of no change in prices.

The Accumulation/Distribution indicator takes into account both price and volume data. This helps traders spot buying and selling pressure. Here are some tips to get the most out of the indicator:

  1. Combine it with other indicators: Use with moving averages or oscillators for more confirmation.
  2. Look out for divergences: These may show an upcoming change in direction and present potential trading opportunities.
  3. Ensure breakouts and trends are true: Use the Accumulation/Distribution indicator to validate and check the strength of the trend. Divergences here can warn of possible false signals.

Incorporate these tips into your trading strategy and use the Accumulation/Distribution indicator to make informed decisions. Don’t forget to always consider the overall market context and use risk management.

Conclusion and Final Tips for Successful Use of the Accumulation/Distribution Indicator

The Accumulation/Distribution Indicator is a great asset for traders. Here are some tips to use it right:

  1. Keep up with market trends and news to anticipate buying and selling.
  2. Keep an eye on volume to back up price movements.
  3. Use this indicator with other analysis tools to be sure of your decisions. For example, pair it with moving averages for extra insight into potential reversals or trend directions.

Unique details to remember: this indicator calculates money flow based on both price and volume. It looks at whether prices close higher or lower than the prior period’s close, and if trading happened at the high or low end of the day’s range.

Let me tell you about Sarah. She was using different technical analysis tools but wanted to advance her strategy. She integrated the Accumulation/Distribution Indicator into her analysis. This helped her greatly in her trading. By watching money flow shifts and combining it with other indicators, Sarah improved her decisions and upped her profits.

Frequently Asked Questions

1. What is the Accumulation/Distribution Indicator?

The Accumulation/Distribution Indicator is a technical analysis tool used to measure the buying and selling pressure in a specific security. It is based on the idea that the volume of trades can reveal the strength of accumulation (buying) or distribution (selling) of a particular asset.

2. How does the Accumulation/Distribution Indicator work?

The indicator calculates the cumulative volume flow based on the price movement of a security. If the current closing price is higher than the previous closing price, it suggests accumulation as more buyers are entering the market. On the other hand, if the current closing price is lower, it indicates distribution as more investors are selling the asset.

3. What are the key components of the Accumulation/Distribution Indicator?

The key components of this indicator include the volume of trades, the closing price, and a formula to calculate the Accumulation/Distribution line. The line is created by multiplying the multiplier value with the period’s volume and adding/subtracting it to the previous Accumulation/Distribution value.

4. How is the Accumulation/Distribution Indicator interpreted?

Traders and analysts look for divergences between the price movement of an asset and the Accumulation/Distribution line. When the indicator diverges from the price, it indicates a potential reversal in the current trend. Additionally, high values of the Accumulation/Distribution line suggest a strong buying pressure, while low values indicate selling pressure.

5. How can the Accumulation/Distribution Indicator be used in trading?

Traders commonly use the Accumulation/Distribution Indicator to confirm trends, identify potential reversals, and as a tool for risk management. It can help traders make informed decisions about buying or selling a security by evaluating the strength of market participant’s actions.

6. Are there any limitations to using the Accumulation/Distribution Indicator?

Like any technical analysis tool, the Accumulation/Distribution Indicator is not foolproof and should not be used as the sole basis for trading decisions. It is best used in conjunction with other indicators and chart patterns to validate signals and confirm market conditions.

Click to rate this post!
[Total: 2 Average: 5]