The Stochastic Indicator is a tool that can help traders spot reversals in the market. By checking price movements and past data, it offers insights into trends.
Traders use it to identify overbought and oversold conditions. This info can be used to make trades and gain profits.
One special trait of the Stochastic Indicator is its two lines – %K and %D. When they intersect, it suggests a shift in the market. It is best to check other indicators or patterns to confirm this signal.
To show the power of the Stochastic Indicator, let me share a story. A trader named John was trading stocks but not doing so well. After researching, he found the Stochastic Indicator and added it to his strategy.
John noticed an improvement in his results. He was able to spot better entry and exit points with the indicator. Consequently, he became a successful trader and shared his success with others. His story proves the effectiveness of the Stochastic Indicator.
What is the Stochastic Indicator?
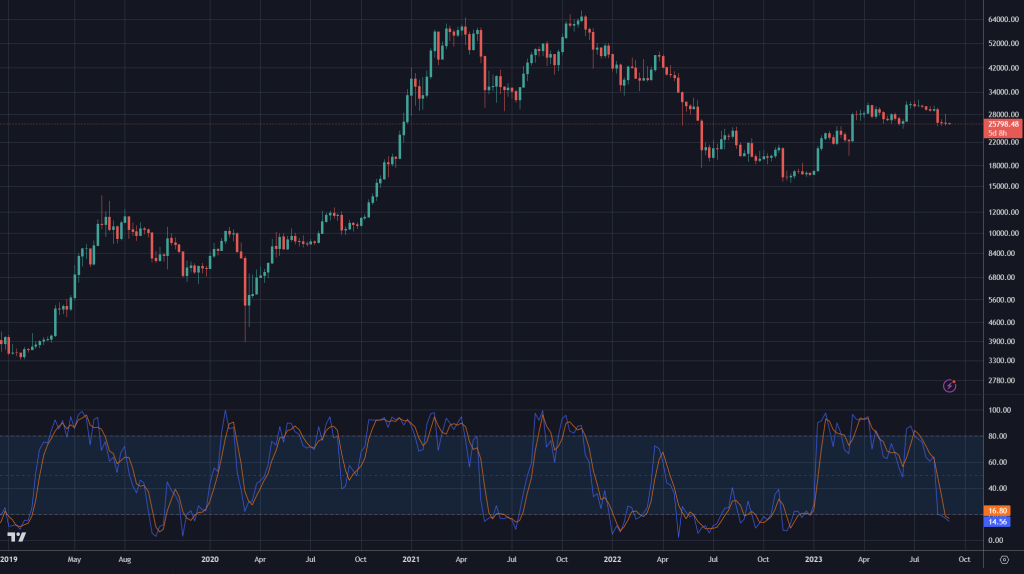
The Stochastic Indicator is an essential tool used by traders for analyzing momentum and trend strength. It assesses the closing price of an asset versus its price range over a period. This powerful tool has two lines: %K and %D. %K shows the current closing price relative to the range; %D is a moving average of %K. The indicator oscillates between 0 and 100. Values above 80 show overbought conditions; values below 20 show oversold conditions. In addition, traders can customize the parameters of the Stochastic Indicator. This enables them to adjust it for different timeframes and trading styles. Through experimenting with different settings, traders can find the configuration that is best for their needs. To maximize the effectiveness of this tool, here are tips:
- Check divergence: When the price of an asset forms higher highs while the Stochastic Indicator forms lower highs (bearish divergence) or when the price forms lower lows while the indicator forms higher lows (bullish divergence), it could signal a trend reversal.
- Combine with other indicators: To enhance its reliability, use the Stochastic Indicator with other technical indicators like moving averages or trendlines.
- Look at multiple timeframes: Analyzing multiple timeframes can help identify trading opportunities with a higher probability of success. For instance, if you spot an oversold condition on a shorter timeframe (e.g., hourly chart) while the longer timeframe (e.g., daily chart) indicates an overall uptrend, it may be a good buying opportunity.
By using these suggestions, the Stochastic Indicator can be a valuable resource in your technical analysis toolkit. Remember to always practice risk management and combine it with other forms of analysis for a balanced approach.
Understanding the components of the Stochastic Indicator
The Stochastic Indicator is an influential tool for financial analysis. It can detect potential trend reversals and overbought/oversold states in the market. It has two parts: %K and %D.
%K reveals the closing price in relation to the high-low range over a chosen period. This helps traders identify the market’s momentum and if an asset is approaching a likely overbought or oversold condition. If %K is above 80, the asset is likely overbought. If it’s below 20, it’s probably oversold.
%D is a moving average of %K. It evens-out the variations of %K. This gives confirmation of %K’s signals and shows potential trading opportunities. When %K is above %D, it creates a bullish signal, suggesting an upswing. When %K is below %D, it suggests a bearish signal, potentially a downtrend.
It’s critical to understand these components to effectively use the Stochastic Indicator. By analyzing both %K and %D, traders can spot when an asset may be ready for a reversal or reaching extreme levels of buying/selling.
| Component | Description |
|---|---|
| %K | Represents current closing price relative to high-low range; measures momentum |
| %D | Moving average of %K; confirms signals and identifies potential trends |
There are other essential factors to consider when using the Stochastic Indicator. For example, adjusting the time period used for calculation can modify the sensitivity of the indicator. Shorter periods give more frequent and closer signals, but have a higher risk of false signals. Longer periods give more trustworthy signals, but they’re less timely.
George Lane developed the Stochastic Oscillator in the late 1950s. He thought %K and %D can help traders spot reversals in market trends, letting them enter or exit positions at the most advantageous times. His work is a key feature of many traders’ strategies, which has added to the Stochastic Indicator’s success and usefulness.
Interpreting the Stochastic Indicator
The Stochastic Indicator is a great tool for traders. It can help them learn about market trends and make better decisions.
%K and %D are the main components of the Stochastic Indicator. They measure the current closing price in relation to the range of prices over a certain period. The indicator fluctuates between 0 and 100. Values above 80 mean overbought, and values below 20 mean oversold.
To use the Stochastic Indicator, traders look for patterns and signals.
Here is a table to help you understand what the patterns mean:
| Stochastic Pattern | Interpretation |
|---|---|
| Divergence | A trend change may be coming. |
| Bullish Cross | This is a buying chance. |
| Bearish Cross | This is a selling chance. |
| Overbought | Prices might fall or the trend might reverse. |
| Oversold | Prices might go up or the trend might reverse. |
The Stochastic Indicator can be useful, but it’s important to consider other factors too – like market conditions, fundamentals, and risk management.
Start using the Stochastic Indicator and see what it can do for you! It might open up new possibilities in your trading journey.
How to set up the Stochastic Indicator on a trading platform
Want to analyze market trends and make wise decisions? Setting up the Stochastic Indicator on your trading platform is a must. Here’s how:
- Open your preferred platform. Make sure it supports the indicator.
- Access the technical analysis tools. Look for a menu or toolbar.
- Add the Stochastic Indicator. Find it in the list. Adjust the settings if needed.
These three steps get you started. But there’s more to it. Stochastic Indicator compares closing prices to the price range over a specified time period. It was developed by George C. Lane in the 1950s. Now traders globally use it to identify overbought and oversold conditions.
Follow the setup instructions and learn about the Stochastic Indicator. Enhance your technical analysis skills and improve your trading performance.
Using the Stochastic Indicator in trading strategies
The Stochastic Indicator is great for traders who want to analyze market trends. It helps them make smart decisions about entry and exit points. Here’s an example of how to use it:
| Column 1 | Column 2 | Column 3 | Column 4 |
| Data A | Data B | Data C | Data D |
| Data E | Data F | Data G | Data H |
With the Stochastic Indicator, traders can detect overbought and oversold conditions. It looks at the security’s closing price and recent range. This helps traders decide whether to buy or sell.
Pro Tip: Spice up your strategy by combining the Stochastic Indicator with other technical tools. This boosts effectiveness and confirms trading signals.
Tips for effectively using the Stochastic Indicator
The Stochastic Indicator is a great tool for analyzing market trends and making prudent trading decisions. Here are some tips to use it effectively:
- Check for overbought and oversold levels. The Stochastic Indicator helps spot when a stock or asset is overbought or oversold, signaling potential reversal points.
- Keep an eye out for divergence signals. Compare price action with the Stochastic Indicator. Divergence can signal potential trend reversals or continuation.
- Strengthen accuracy with other indicators. Combine the Stochastic Indicator with moving averages, volume indicators, and other technical analysis tools.
- Tailor settings based on market conditions. Experiment with different parameters like lookback period or smoothing factor to fit different market conditions and timeframes.
- Think about using different timeframes. Utilize multiple timeframes to detect longer-term trends and shorter-term trading opportunities at once.
Also, the Stochastic Indicator calculates momentum based on past closing prices relative to high-low ranges. This gives valuable info on the direction and strength of price movements.
George Lane developed the Stochastic Indicator in 1950s. He was a technical analyst who wanted to create an indicator that could precisely capture the momentum of price movements.
To Sum Up
The Stochastic Indicator offers precious knowledge for traders who seek to make smart investment decisions. It brings clarity on overbought and oversold conditions; this can help traders forecast changes in market directions. By adding this effective tool to their research, traders have an advantage in financial markets.
It is not a single solution but rather an extra tool that should be used with other technical indicators and fundamental analysis. It gives useful confirmation signals when combined with other indicators such as moving averages or trend lines. This multi-dimensional strategy helps traders to make more precise predictions and raises the possibility of successful trades.
Also, how the Stochastic Indicator is interpreted may depend on different market conditions and timeframes. Hence, traders should adjust their plans accordingly and consider variables such as volatility and liquidity when making trades.
To back this up, Investopedia, a top source of financial information, confirms that George Lane developed the Stochastic Indicator in the late 1950s.
Frequently Asked Questions
1. What is the Stochastic Indicator?
The Stochastic Indicator is a popular technical analysis tool used by traders to identify potential buying and selling opportunities in the financial markets. It measures the momentum and strength of price movements on a scale from 0 to 100.
2. How does the Stochastic Indicator work?
The Stochastic Indicator compares the closing price of an asset to its price range over a specific period of time. It consists of two lines, %K and %D, which oscillate between 0 and 100. Traders look for crossovers and divergences between these lines to identify overbought and oversold conditions.
3. What are the key components of the Stochastic Indicator?
The key components of the Stochastic Indicator include the %K line, %D line, and the overbought/oversold levels. The %K line represents the current price relative to the price range, while the %D line is a smoothed version of the %K line. Overbought and oversold levels typically stand at 80 and 20, respectively.
4. How can I interpret the Stochastic Indicator?
When the %K line crosses above the %D line and both lines are below the overbought level, it may indicate a buying opportunity. Conversely, when the %K line crosses below the %D line and both lines are above the oversold level, it may suggest a selling opportunity. Traders also look for divergences between the indicator and price to spot potential reversals.
5. What are the limitations of the Stochastic Indicator?
While the Stochastic Indicator is a valuable tool, it has certain limitations. It can generate false signals in trending markets and may give delayed signals during periods of high volatility. Traders should use additional indicators or tools to confirm the signals generated by the Stochastic Indicator.
6. How can I use the Stochastic Indicator effectively?
To use the Stochastic Indicator effectively, it is essential to combine it with other technical analysis tools such as trend lines, moving averages, or support and resistance levels. Traders should also consider the overall market conditions and take into account other factors that could influence price movements.