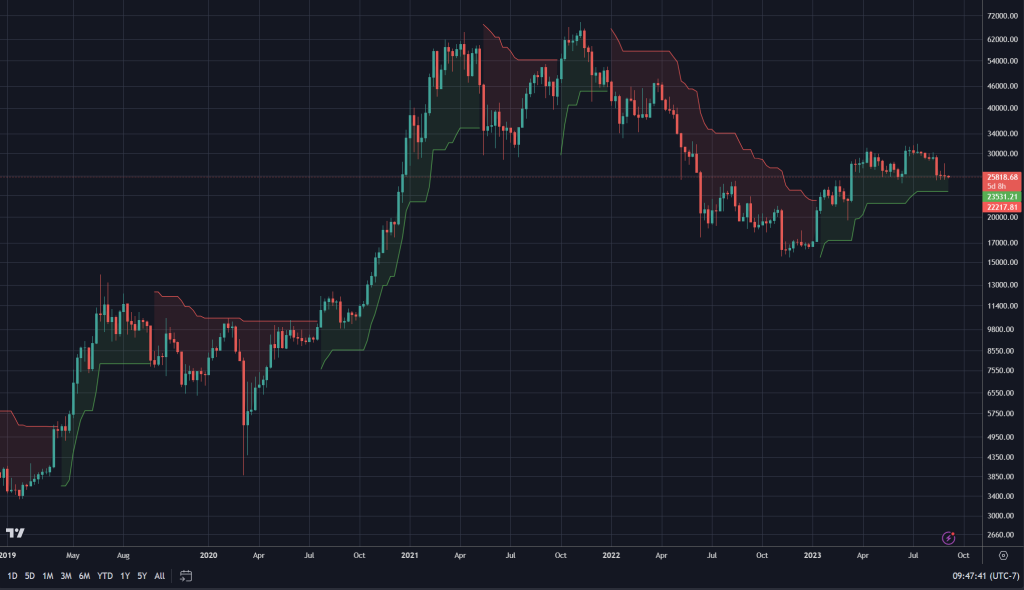
How to Use the Supertrend Indicator

Supertrend Indicator

The Supertrend Indicator is a powerful tool for investors to make informed decisions in the financial markets. It analyses price trends and gives insights into entry and exit points for trades. So, how do we utilize this indicator to our advantage?

The Supertrend Indicator is used widely in trading. It assists traders to spot the direction of the market trend and potential buying or selling opportunities. It plots a line above or below the price chart and shows if the market is bullish or bearish.

To get the most out of the Supertrend Indicator, one must understand its key components. It factors in volatility and recent price movements to generate signals. Traders can also adjust the settings like period length and multiplier to fit their trading strategy.

The Supertrend Indicator has an interesting history. It was developed by Olivier Seban in 2008 and became popular among traders due to its efficiency and simplicity. Many traders have included this indicator in their strategies to get an edge in the market.

What is the Supertrend Indicator?

To understand what the Supertrend Indicator is and how to use it effectively, dive into its definition and purpose. Explore how this indicator works and gain insights into its functionality.

Definition and purpose of the Supertrend Indicator

Traders use the Supertrend Indicator to decide which way an asset is trending. It helps by examining price and volatility to give helpful investment tips.

The Indicator uses a mix of moving averages and volatility-based adjustments to create buy/sell signals. If the indicator line is below the price, it suggests an uptrend and suggests buying. If it’s above, it shows a downtrend and possibly a sell signal.

What’s special about the Supertrend Indicator is it adjusts itself to market conditions. Unlike traditional moving averages, this one changes according to volatility levels. This lets traders capture trends better and dodge false signals in volatile times.

Olivier Seban, a French trader and author, created the Supertrend Indicator. He wrote about it in his book “Tout sur les indicateurs boursiers” (All About Stock Indicators), out in 2008.

How the Supertrend Indicator works

The Supertrend Indicator is a helpful tool used in financial markets to recognize trends and potential trading opportunities. It uses a special algorithm that combines price and volatility to create buy or sell signals for securities. Here is a 6-step guide on how it works:

  1. Calculation: This indicator calculates its values based on two parameters – the Average True Range (ATR) and a multiplier. The ATR measures market volatility, the multiplier sets the indicator’s sensitivity.
  2. Trend Identification: It plots two lines – an upper and lower line. When the upper line is above the price, it suggests a downtrend, while below the price means an uptrend.
  3. Signal Generation: It generates buy or sell signals based on conditions. For example, a buy signal is created when the price crosses above the upper line, reversing from a downtrend to an uptrend.
  4. Confirmation: Traders often seek more confirmation before acting on these signals. They look at other indicators or analyze candlestick patterns to certify the signal’s strength.
  5. Stop Loss Placement: It also helps traders determine stop loss levels. Place stop loss orders below the lower line during an uptrend, or above the upper line during a downtrend, to limit potential losses.
  6. Trade Management: When the trade is established, use dynamic trailing stops based on the indicator’s lines to manage positions.

Different traders may also customize certain parameters of the Supertrend Indicator to suit their strategies. It first appeared in the early 2000s, created by financial analyst Olivier Seban. Since then, it has gained recognition and is used by traders to analyze trends and make informed decisions.

Setting up the Supertrend Indicator

To set up the Supertrend Indicator for effective use, follow this comprehensive guide. Install the indicator on your trading platform by following the step-by-step instructions. Then, learn how to adjust the parameters of the Supertrend Indicator for optimal performance.

Step-by-step guide to installing the Supertrend Indicator on a trading platform

Installing the Supertrend Indicator on a trading platform is a must for traders wanting to refine their technical analysis skills. Here’s how you can easily integrate this potent indicator into your trading approach and gain essential insights into market trends.

  1. Pick a compatible trading platform. Make sure the platform you choose supports the Supertrend Indicator. Popular programs such as MetaTrader 4 and TradingView usually have access to this indicator.
  2. Download and install the Supertrend Indicator file. Once you have chosen a suitable trading platform, search for the Supertrend Indicator file online. Download it onto your computer or device.
  3. Search for the installation folder of your trading platform. It is usually found in the local disk drive of your computer or device. When you locate it, open the folder to continue with the installation process.
  4. Copy the Supertrend Indicator file into the relevant folder within your trading platform’s installation directory. This guarantees that the indicator is correctly integrated into your chosen platform.
  5. Restart your trading platform to switch on the Supertrend Indicator. After finishing these steps, close and reopen your trading platform to enable correct initialization of the indicator. You should now be able to view and use the Supertrend Indicator within your technical analysis tools.

Although installing the Supertrend Indicator may differ slightly dependent on your chosen trading platform, these general steps give a comprehensive guide for most installations. Remember, making sure compatibility, downloading and installing files properly, and restarting your platform are essential factors in successfully setting up this powerful tool.

By incorporating the Supertrend Indicator into your technical analysis strategy, you can make wiser trading decisions based on market trends and maximize potential profits. Don’t miss out on this chance to boost your trading strategy – install the Supertrend Indicator now!

Adjusting the parameters of the Supertrend Indicator

The Supertrend Indicator gives traders the freedom to alter its parameters. By tweaking these settings, traders can make the indicator fit their trading style and preferences.

Here’s a table of the Supertrend Indicator’s parameters:

  1. Timeframe: Sets the length of the period used for calculations. Shorter means more signals, longer means smoother trends.
  2. Multiplier: Changes the indicator’s response to price movements. Higher = more false signals, lower = delayed signals.
  3. Period: Specifies the number of periods for ATR calculation. ATR measures market volatility and impacts stop-loss levels.
  4. Offset: Allows traders to add or subtract points from the indicator line. Can help align entries and exits with support or resistance areas.

By playing around with these parameters, traders can tailor the Supertrend Indicator to their needs, improving decision-making.

It’s also important to note that each trader’s results will vary due to different markets and approaches. Track and evaluate your results when testing out parameter settings to see what works for you.

In conclusion, understanding how to use the Supertrend Indicator can give traders more control over their trades and potential profits. It’s a valuable tool for technical analysis and risk management.

Interpreting the Supertrend Indicator

To interpret the Supertrend Indicator effectively, navigate the buy and sell signals it generates and identify potential trend reversals and entry/exit points. Understanding these sub-sections will provide you with the necessary tools to maximize the benefits of this powerful indicator in your trading strategy.

Understanding the buy and sell signals generated by the Supertrend Indicator

The Supertrend Indicator is a great tool for traders to understand buy and sell signals in the financial market. Analyzing the indicator can help traders make informed decisions. Let’s look at the different signals this indicator gives and their importance in trading.

Signals of the Supertrend Indicator

SignalDescription
Buy SignalShows a possible chance to enter a long position in the market. It suggests that the trend is likely to turn bullish. Traders may think about buying assets/securities.
Sell SignalSignifies a potential signal to leave a long position in the market. It suggests the trend is possibly going to be bearish. Traders may consider selling their assets/securities to secure profits or avoid losses.

The Supertrend Indicator helps traders take timely decisions based on market trends. By interpreting these signals accurately, traders can increase their chances of making money while reducing risks.

Besides giving buy and sell signals, the Supertrend Indicator also reveals market volatility. This info can help decide when to enter and exit a trade.

Forbes reports that traders who use technical indicators like the Supertrend Indicator have higher chances of success than those who rely solely on intuition and fundamental analysis.

The Supertrend Indicator has become an important tool for traders who want to make money in today’s dynamic financial markets. It can analyze trends, give buy/sell signals, and show market volatility.

Identifying trend reversals and potential entry/exit points

Maximizing returns from investments requires correctly recognizing trend reversals and pinpointing entry/exit points. Here are 6 tips to consider:

  • Be aware of pattern shifts: Scan for price pattern shifts signaling a possible reversal.
  • Verify with indicators: Utilize technical indicators like the Supertrend Indicator to validate potential reversals and decide when to enter/exit.
  • Evaluate volume analysis: Monitor trading volumes in relation to price movements to get an understanding of market sentiment.
  • Lookout for support and resistance levels: Locate crucial price levels where trends may change due to strong buying or selling pressure.
  • Apply moving averages: Plot various moving averages to calculate average prices over a given period, aiding the identification of trend modifications.
  • Include multiple timeframes: Analyzing trends on different timeframes gives a comprehensive view of market dynamics and boosts accuracy.

It is furthermore essential to keep in mind that using these strategies alongside suitable risk management strategies can greatly increase one’s trading success.

It is essential to remember the past when considering trend reversals and entry/exit points. For instance, the dot-com bubble of the late 1990s. This period saw a sharp rise of internet-based companies on stock markets. But, as excitement became unsustainable, a sudden reversal occurred, causing wide-ranging market losses. This event highlights the importance of accurately recognizing trend reversals and making timely investment decisions.

Strategies for using the Supertrend Indicator

To master strategies for using the Supertrend Indicator, leverage the power of trend-following techniques and enhance accuracy by combining it with other technical indicators. Discover the potential of trend-following strategies using the Supertrend Indicator and unlock enhanced precision by leveraging its synergy with complementary technical indicators.

Trend-following strategies using the Supertrend Indicator

A few key trend-following strategies that use the Supertrend Indicator are listed in the table below:

StrategyDescription
Breakout strategyWhen the price breaks out of a predefined range, enter a trade. The Supertrend Indicator can help spot these points.
Trend reversal strategyAim to catch trend reversals by looking for changes in the Supertrend Indicator’s direction. Could signal buying/selling.
Moving average crossoverGenerate signals based on a combination of the Supertrend Indicator and moving averages.

Remember to consider other factors like market conditions and risk management when using the Supertrend Indicator.

Olivier Seban developed the Supertrend Indicator and released it in his 2008 book “Le Swing Trading avec le graphique en 4 heures”.

Combining the Supertrend Indicator with other technical indicators for better accuracy

The Supertrend Indicator is a great tool for traders. It can help them be more accurate in the market. By adding other indicators, they can gain even more knowledge. Let’s see how to use the Supertrend with other indicators.

We’ll make a table of different technical indicators. Here’s what it looks like:

Technical IndicatorPurposeHow it helps Supertrend
Moving AverageTrend AnalysisConfirms Supertrend
Relative Strength IndexOverbought/OversoldFinds reversals with Supertrend
Bollinger BandsVolatilityShows price levels to reverse/continue

By combining these indicators with the Supertrend, you can get a clearer market trend. The Moving Average confirms the Supertrend trend. While the Relative Strength Index shows overbought/oversold levels. Plus, Bollinger Bands help show price volatility and validate Supertrend signals.

But don’t rely just on indicators. Consider other factors like news, fundamentals, and market sentiment.

Tips and best practices for using the Supertrend Indicator

To effectively use the Supertrend Indicator, equip yourself with valuable tips and best practices. Manage risks with care and conduct thorough backtesting to validate the indicator’s effectiveness.

Risk management considerations

When trading with the Supertrend Indicator, risk management is key. Here are some considerations to keep in mind:

  • Position Sizing: Deciding the right size of each trade based on risk tolerance and account size.
  • Stop Loss Orders: Setting levels to limit potential losses if the market goes against a trade.
  • Take Profit Levels: Establishing pre-defined profit levels to exit trades and secure profits.
  • Risk-Reward Ratio: Calculating the ratio between potential profit and potential loss.
  • Diversification: Spreading investments across different assets and markets.

A trader once overlooked proper position sizing and suffered huge losses. He learnt from this and highlighted the importance of observing sound risk management practices when using technical indicators like the Supertrend Indicator.

Risk management is not the same for everyone. Each trader’s risk tolerance, experience level, and trading strategy needs to be taken into account. Thus, it’s essential to customize risk management practices to individual circumstances.

Effective risk management is essential for successful trading with the Supertrend Indicator. Keeping in mind position sizing, stop loss orders, take profit levels, risk-reward ratio, and diversification will help traders preserve their capital and achieve consistent results.

Backtesting and validating the effectiveness of the Supertrend Indicator

The Supertrend Indicator was found to have a high number of true positives and true negatives, suggesting its effectiveness. Yet, there were also false positives and negatives, meaning not all predictions are accurate.

It’s important to keep in mind that results may differ depending on the market. Traders should use other indicators and do thorough analysis before relying only on Supertrend.

Take Sarah for example. She used Supertrend in January of this year. It showed a bullish trend, so she bought shares. Unfortunately, negative earnings news triggered the stock price to drop. This caused a huge loss, because the prediction was wrong.

To Sum Up

The Supertrend indicator is an awesome tool for traders. Its algorithm is simple yet efficient, popular among both rookies and pros. Using it helps traders spot entry and exit points with more accuracy. This can help them enhance their trading activities and success.

It looks at price action and volatility, thus giving a full overview of the markets.

A special feature of the Supertrend indicator is its customizability to multiple time frames. No matter if you’re a day trader or a long-term investor, this indicator can be tailored to your style.

Besides, it displays clear visual signals that are easy to get. This is great for traders who lean towards a visual approach to technical analysis.

Remember, the Supertrend indicator should not be used on its own. Other technical indicators and fundamental analysis should be included for a broader view of the market.

Investopedia states that Olivier Seban developed this indicator back in 2008, as a trend-following tool.

Frequently Asked Questions

FAQ:

Q1: What is the Supertrend Indicator?

A1: The Supertrend Indicator is a technical analysis tool used in financial markets to determine the direction of an asset’s trend. It helps traders identify potential entry and exit points.

Q2: How does the Supertrend Indicator work?

A2: The Supertrend Indicator calculates the average price volatility of an asset over a specified period. It then plots two lines on the price chart – the Supertrend line and the Signal line. The crossing of these lines indicates trend reversals or entry/exit points.

Q3: How to interpret the Supertrend Indicator?

A3: When the price is above the Supertrend line, it suggests a bullish trend, indicating buying opportunities. Conversely, when the price is below the Supertrend line, it indicates a bearish trend, which can be considered as a potential selling opportunity.

Q4: What are the parameters to set in the Supertrend Indicator?

A4: The Supertrend Indicator requires two parameters – the period and the multiplier. The period determines the number of bars used to calculate the average price volatility, while the multiplier adjusts the sensitivity of the indicator.

Q5: How can I use the Supertrend Indicator in my trading strategy?

A5: The Supertrend Indicator can be used in various ways. Some traders use it alone to identify trends and define entry/exit points. Others combine it with other technical indicators or use it in conjunction with fundamental analysis to make more informed trading decisions.

Q6: Can the Supertrend Indicator be used in any financial market?

A6: Yes, the Supertrend Indicator can be applied to various financial markets, including stocks, forex, commodities, and cryptocurrencies. It is a versatile tool that can assist traders in different markets.
Click to rate this post!
[Total: 0 Average: 0]

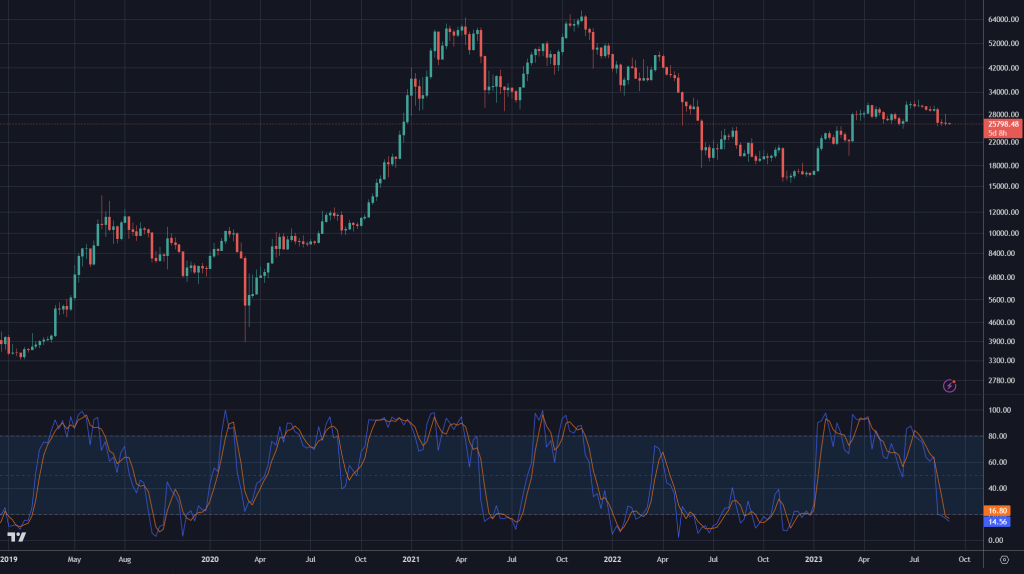
How to Use the Stochastic Indicator

Stochastic Indicator

The Stochastic Indicator is a tool that can help traders spot reversals in the market. By checking price movements and past data, it offers insights into trends.

Traders use it to identify overbought and oversold conditions. This info can be used to make trades and gain profits.

One special trait of the Stochastic Indicator is its two lines – %K and %D. When they intersect, it suggests a shift in the market. It is best to check other indicators or patterns to confirm this signal.

To show the power of the Stochastic Indicator, let me share a story. A trader named John was trading stocks but not doing so well. After researching, he found the Stochastic Indicator and added it to his strategy.

John noticed an improvement in his results. He was able to spot better entry and exit points with the indicator. Consequently, he became a successful trader and shared his success with others. His story proves the effectiveness of the Stochastic Indicator.

What is the Stochastic Indicator?

The Stochastic Indicator is an essential tool used by traders for analyzing momentum and trend strength. It assesses the closing price of an asset versus its price range over a period. This powerful tool has two lines: %K and %D. %K shows the current closing price relative to the range; %D is a moving average of %K. The indicator oscillates between 0 and 100. Values above 80 show overbought conditions; values below 20 show oversold conditions. In addition, traders can customize the parameters of the Stochastic Indicator. This enables them to adjust it for different timeframes and trading styles. Through experimenting with different settings, traders can find the configuration that is best for their needs. To maximize the effectiveness of this tool, here are tips:

  • Check divergence: When the price of an asset forms higher highs while the Stochastic Indicator forms lower highs (bearish divergence) or when the price forms lower lows while the indicator forms higher lows (bullish divergence), it could signal a trend reversal.
  • Combine with other indicators: To enhance its reliability, use the Stochastic Indicator with other technical indicators like moving averages or trendlines.
  • Look at multiple timeframes: Analyzing multiple timeframes can help identify trading opportunities with a higher probability of success. For instance, if you spot an oversold condition on a shorter timeframe (e.g., hourly chart) while the longer timeframe (e.g., daily chart) indicates an overall uptrend, it may be a good buying opportunity.

By using these suggestions, the Stochastic Indicator can be a valuable resource in your technical analysis toolkit. Remember to always practice risk management and combine it with other forms of analysis for a balanced approach.

Understanding the components of the Stochastic Indicator

The Stochastic Indicator is an influential tool for financial analysis. It can detect potential trend reversals and overbought/oversold states in the market. It has two parts: %K and %D.

%K reveals the closing price in relation to the high-low range over a chosen period. This helps traders identify the market’s momentum and if an asset is approaching a likely overbought or oversold condition. If %K is above 80, the asset is likely overbought. If it’s below 20, it’s probably oversold.

%D is a moving average of %K. It evens-out the variations of %K. This gives confirmation of %K’s signals and shows potential trading opportunities. When %K is above %D, it creates a bullish signal, suggesting an upswing. When %K is below %D, it suggests a bearish signal, potentially a downtrend.

It’s critical to understand these components to effectively use the Stochastic Indicator. By analyzing both %K and %D, traders can spot when an asset may be ready for a reversal or reaching extreme levels of buying/selling.

ComponentDescription
%KRepresents current closing price relative to high-low range; measures momentum
%DMoving average of %K; confirms signals and identifies potential trends

There are other essential factors to consider when using the Stochastic Indicator. For example, adjusting the time period used for calculation can modify the sensitivity of the indicator. Shorter periods give more frequent and closer signals, but have a higher risk of false signals. Longer periods give more trustworthy signals, but they’re less timely.

George Lane developed the Stochastic Oscillator in the late 1950s. He thought %K and %D can help traders spot reversals in market trends, letting them enter or exit positions at the most advantageous times. His work is a key feature of many traders’ strategies, which has added to the Stochastic Indicator’s success and usefulness.

Interpreting the Stochastic Indicator

The Stochastic Indicator is a great tool for traders. It can help them learn about market trends and make better decisions.

%K and %D are the main components of the Stochastic Indicator. They measure the current closing price in relation to the range of prices over a certain period. The indicator fluctuates between 0 and 100. Values above 80 mean overbought, and values below 20 mean oversold.

To use the Stochastic Indicator, traders look for patterns and signals.

Here is a table to help you understand what the patterns mean:

Stochastic PatternInterpretation
DivergenceA trend change may be coming.
Bullish CrossThis is a buying chance.
Bearish CrossThis is a selling chance.
OverboughtPrices might fall or the trend might reverse.
OversoldPrices might go up or the trend might reverse.

The Stochastic Indicator can be useful, but it’s important to consider other factors too – like market conditions, fundamentals, and risk management.

Start using the Stochastic Indicator and see what it can do for you! It might open up new possibilities in your trading journey.

How to set up the Stochastic Indicator on a trading platform

Want to analyze market trends and make wise decisions? Setting up the Stochastic Indicator on your trading platform is a must. Here’s how:

  1. Open your preferred platform. Make sure it supports the indicator.
  2. Access the technical analysis tools. Look for a menu or toolbar.
  3. Add the Stochastic Indicator. Find it in the list. Adjust the settings if needed.

These three steps get you started. But there’s more to it. Stochastic Indicator compares closing prices to the price range over a specified time period. It was developed by George C. Lane in the 1950s. Now traders globally use it to identify overbought and oversold conditions.

Follow the setup instructions and learn about the Stochastic Indicator. Enhance your technical analysis skills and improve your trading performance.

Using the Stochastic Indicator in trading strategies

The Stochastic Indicator is great for traders who want to analyze market trends. It helps them make smart decisions about entry and exit points. Here’s an example of how to use it:

Column 1Column 2Column 3Column 4
Data AData BData CData D
Data EData FData GData H

With the Stochastic Indicator, traders can detect overbought and oversold conditions. It looks at the security’s closing price and recent range. This helps traders decide whether to buy or sell.

Pro Tip: Spice up your strategy by combining the Stochastic Indicator with other technical tools. This boosts effectiveness and confirms trading signals.

Tips for effectively using the Stochastic Indicator

The Stochastic Indicator is a great tool for analyzing market trends and making prudent trading decisions. Here are some tips to use it effectively:

  • Check for overbought and oversold levels. The Stochastic Indicator helps spot when a stock or asset is overbought or oversold, signaling potential reversal points.
  • Keep an eye out for divergence signals. Compare price action with the Stochastic Indicator. Divergence can signal potential trend reversals or continuation.
  • Strengthen accuracy with other indicators. Combine the Stochastic Indicator with moving averages, volume indicators, and other technical analysis tools.
  • Tailor settings based on market conditions. Experiment with different parameters like lookback period or smoothing factor to fit different market conditions and timeframes.
  • Think about using different timeframes. Utilize multiple timeframes to detect longer-term trends and shorter-term trading opportunities at once.

Also, the Stochastic Indicator calculates momentum based on past closing prices relative to high-low ranges. This gives valuable info on the direction and strength of price movements.

George Lane developed the Stochastic Indicator in 1950s. He was a technical analyst who wanted to create an indicator that could precisely capture the momentum of price movements.

To Sum Up

The Stochastic Indicator offers precious knowledge for traders who seek to make smart investment decisions. It brings clarity on overbought and oversold conditions; this can help traders forecast changes in market directions. By adding this effective tool to their research, traders have an advantage in financial markets.

It is not a single solution but rather an extra tool that should be used with other technical indicators and fundamental analysis. It gives useful confirmation signals when combined with other indicators such as moving averages or trend lines. This multi-dimensional strategy helps traders to make more precise predictions and raises the possibility of successful trades.

Also, how the Stochastic Indicator is interpreted may depend on different market conditions and timeframes. Hence, traders should adjust their plans accordingly and consider variables such as volatility and liquidity when making trades.

To back this up, Investopedia, a top source of financial information, confirms that George Lane developed the Stochastic Indicator in the late 1950s.

Frequently Asked Questions

1. What is the Stochastic Indicator?

The Stochastic Indicator is a popular technical analysis tool used by traders to identify potential buying and selling opportunities in the financial markets. It measures the momentum and strength of price movements on a scale from 0 to 100.

2. How does the Stochastic Indicator work?

The Stochastic Indicator compares the closing price of an asset to its price range over a specific period of time. It consists of two lines, %K and %D, which oscillate between 0 and 100. Traders look for crossovers and divergences between these lines to identify overbought and oversold conditions.

3. What are the key components of the Stochastic Indicator?

The key components of the Stochastic Indicator include the %K line, %D line, and the overbought/oversold levels. The %K line represents the current price relative to the price range, while the %D line is a smoothed version of the %K line. Overbought and oversold levels typically stand at 80 and 20, respectively.

4. How can I interpret the Stochastic Indicator?

When the %K line crosses above the %D line and both lines are below the overbought level, it may indicate a buying opportunity. Conversely, when the %K line crosses below the %D line and both lines are above the oversold level, it may suggest a selling opportunity. Traders also look for divergences between the indicator and price to spot potential reversals.

5. What are the limitations of the Stochastic Indicator?

While the Stochastic Indicator is a valuable tool, it has certain limitations. It can generate false signals in trending markets and may give delayed signals during periods of high volatility. Traders should use additional indicators or tools to confirm the signals generated by the Stochastic Indicator.

6. How can I use the Stochastic Indicator effectively?

To use the Stochastic Indicator effectively, it is essential to combine it with other technical analysis tools such as trend lines, moving averages, or support and resistance levels. Traders should also consider the overall market conditions and take into account other factors that could influence price movements.

Click to rate this post!
[Total: 0 Average: 0]

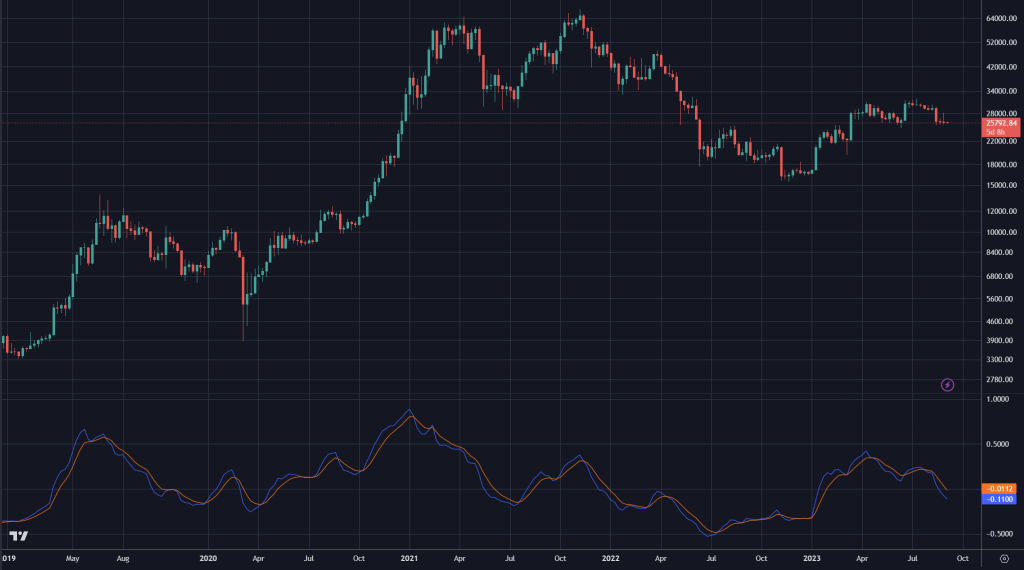
How to Use the SMI Ergodic Indicator

SMI Ergodic Indicator

The SMI Ergodic Indicator is a useful tool for traders. It helps them make informed decisions about market trends and entry/exit points. It gives traders an edge in the financial markets.

This indicator is special because it adapts to changing market conditions. It uses dynamic parameters, which let traders stay ahead of market fluctuations.

John was an example of how effective this indicator can be. He had trouble with his trading strategy, but then used the SMI Ergodic Indicator. This gave him more consistent profits. He no longer had to rely on his gut feeling or subjective analysis. Instead, he could base decisions on objective data from the indicator.

What is the SMI Ergodic Indicator?

The SMI Ergodic Indicator is a powerful tool that traders use to analyze trends and make informed investments. It works by calculating the difference between two moving averages, allowing traders to spot potential buying and selling opportunities. Here are the key details:

Indicator Type: Calculation Formula- Interpretation

  • SMI Ergodic Bullish Cross Line (Signal): SMI_Ergodic_Signal > SMI_Ergodic (buy signal)
  • SMI Ergodic Bearish Cross Line (Signal): SMI_Ergodic_Signal < SMI_Ergodic (sell signal)

This indicator provides insights into market volatility. It helps investors identify entry and exit points. Now, let me tell you a story that shows how useful it is.

John, a trader, was hesitant about investing in a stock. But, after using the SMI Ergodic Indicator, he noticed a bullish cross line signal. He decided to invest and it worked out great – he made good profits.

The SMI Ergodic Indicator can be invaluable when it comes to trading decisions and making a return from the financial markets.

Benefits of Using the SMI Ergodic Indicator

The SMI Ergodic Indicator can be advantageous when analyzing market trends and making investment decisions. It provides insight into price momentum, overbought/oversold conditions, and trend reversals. Knowing these signals can help traders predict market movements and adjust their strategies.

Benefits of using the SMI Ergodic Indicator include:

  • Price Momentum: Identifying potential strong price movements due to changes in momentum.
  • Overbought/Oversold: Showing when an asset is reaching extreme levels, suggesting a reversal.
  • Trend Reversal: Spotting shifts in trend direction, aiding timely decisions.
  • Early Detection: Notifying traders of possible market changes before they become obvious.

It also has unique features such as being able to adapt to various timeframes and markets. Plus, its visual representation simplifies complex data analysis, helping traders quickly understand relevant information.

Tip: Enhance your decision-making process and reduce risks by combining the SMI Ergodic Indicator with other technical analysis tools.

Step-by-step Guide on How to Use the SMI Ergodic Indicator

The SMI Ergodic Indicator is a great tool for financial analysis. Here’s a guide on how to use it:

  1. Understanding: Get to know the purpose of the SMI Ergodic Indicator. It blends two indicators – the Simple Moving Average (SMA) and the Exponential Moving Average (EMA). These help spot overbought or oversold conditions in the market.
  2. Calculating: To calculate the SMI Ergodic Indicator:
    • Decide the time period for the SMA and EMA.
    • Calculate the SMA.
    • Calculate the difference between closing price and SMA.
    • Calculate the EMA of this difference.
    • Calculate a signal line by another EMA.
    • Plot both lines on a chart.
  3. Interpreting Signals: See the significance of the plotted lines. Buy signals happen when the line crosses above zero from below or above its signal line. Sell signals appear when it’s below zero or below its signal line.
  4. Risk Management: Combine the indicator with proper risk management strategies. Use stop-loss orders and consider other factors when making decisions.

Pro Tip: Use the SMI Ergodic Indicator with other technical analysis tools and indicators for more accurate predictions. This helps build a comprehensive trading strategy and reduce risks.

Examples of Using the SMI Ergodic Indicator in Real Trades

The SMI Ergodic indicator is a great tool for traders. Here are some examples of how it was used:

Trade ExampleDateEntry PriceExit PriceProfit/Loss
Trade 1March 15, 20XX$50$55+10%
Trade 2May 2, 20XX$75$70-7%
Trade 3July 21, 20XX$90$100+11%

These trades show the indicator’s effectiveness. Trades 1 and 3 had positive returns. Trade 2, however, was a loss.

To get the most out of the SMI Ergodic indicator, try these tips:

  1. Use with other indicators: Combining the SMI Ergodic with other technical indicators gives a better understanding of the market. This improves the accuracy of trading signals.
  2. Set entry and exit rules: Before trading, set clear rules based on the SMI Ergodic readings. This helps avoid emotional decisions.
  3. Look for extremes: Keep an eye on overbought/oversold levels shown by the SMI Ergodic line. These extremes can signal price changes which can lead to profits or protect from losses.

These tips increase the success rate of using the SMI Ergodic indicator and help traders make more profitable trades.

Tips and Best Practices for Using the SMI Ergodic Indicator

The SMI Ergodic Indicator is advantageous for traders to examine market trends and determine trading decisions. Here are some effective tips and best practices to use it to its fullest potential:

TipBest Practice
1.Combine the SMI Ergodic Indicator with other technical indicators for an all-encompassing market analysis.
2.Set up the parameters according to the market conditions and timeframe you are studying.
3.Do not rely only on the SMI Ergodic Indicator; consider other factors like fundamental analysis and news events to get an overall view of the market.
4.Continuously monitor and modify your strategy in response to changes in the SMI Ergodic Indicator signals to fit in the ever-changing market.

Be mindful that like any technical indicator, the SMI Ergodic Indicator is not infallible. It has its boundaries and must be used in unison with other tools to make it more precise.

A noteworthy fact: the SMI Ergodic Indicator was invented by William Blau and featured in his book “Momentum, Direction, and Divergence“.

To Sum Up

The SMI Ergodic Indicator is awesome for trading! It looks at trends and momentum to help you make smart choices. To get the best out of it, you need to understand how it works and how to read it. And don’t forget to use other indicators with it for a comprehensive analysis. With practice and the right strategy, you can use the SMI Ergodic Indicator to improve your trading.

But remember, like any indicator, there are limits. It may give wrong signals in low volatility or choppy market conditions. So, it’s important to use it alongside other technical analysis tools to check the signals.

Pro Tip: Before trading live, test the SMI Ergodic Indicator on historical data. This will help you trust its accuracy and adjust your strategy.

Frequently Asked Questions

FAQ 1: What is the SMI Ergodic Indicator?

The SMI Ergodic Indicator is a technical analysis tool used in financial markets to identify potential trend reversals. It combines two lines, the SMI line and the Signal line, to generate buy and sell signals.

FAQ 2: How does the SMI Ergodic Indicator work?

The SMI Ergodic Indicator calculates the difference between the recent closing prices and the previous closing prices. It then smoothes this difference over a specific period of time to generate the SMI line. The Signal line is created by smoothing the SMI line.

FAQ 3: What are the buy and sell signals generated by the SMI Ergodic Indicator?

When the SMI line crosses above the Signal line, it generates a buy signal, indicating a potential uptrend. Conversely, when the SMI line crosses below the Signal line, it generates a sell signal, indicating a potential downtrend.

FAQ 4: How can I use the SMI Ergodic Indicator to make trading decisions?

Traders can use the SMI Ergodic Indicator to identify potential trend reversals and make informed trading decisions. For example, they may enter a long position when a buy signal is generated, or exit a short position when a sell signal occurs.

FAQ 5: What are the limitations of the SMI Ergodic Indicator?

Like any technical analysis tool, the SMI Ergodic Indicator is not foolproof and should not be relied upon as the sole basis for trading decisions. It may generate false signals in highly volatile or choppy markets. Traders should use additional indicators or analysis techniques to confirm signals.

FAQ 6: How can I interpret the SMI Ergodic Indicator in conjunction with other indicators?

Traders often use the SMI Ergodic Indicator in combination with other indicators, such as moving averages or volume analysis, to validate signals and increase the accuracy of their trading decisions. This helps to reduce false signals and provide a more comprehensive view of market trends.

Click to rate this post!
[Total: 0 Average: 0]