The Bull Bear Power Indicator is a useful tool for traders. It provides insight into the strength of bulls and bears in the market. This helps traders make better decisions about their investments.
Here’s an overview of the indicator:
Indicator Name
Bull Bear Power Indicator
Type
Momentum Indicator
Calculation
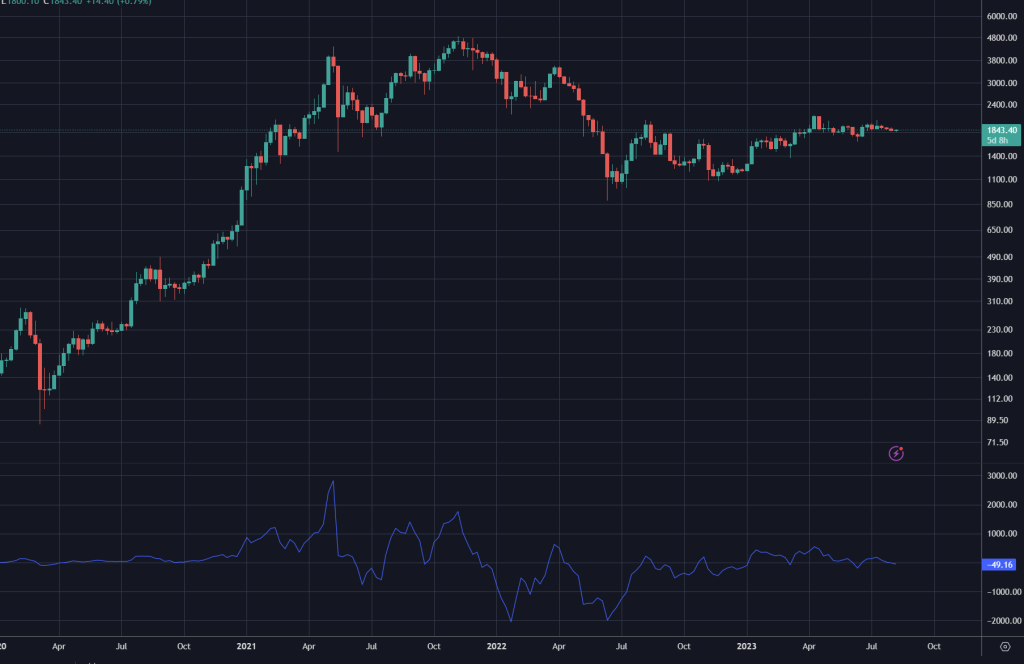
Difference between 13-day and 26-day exponential moving averages (EMA)
Identify buying or selling opportunities based on changes in momentum.
This indicator uses two exponential moving averages to see if bulls or bears are in charge. Positive values mean bulls are stronger, which suggests an upward trend. Negative values indicate the bears are winning, meaning a downward trend. Traders use this info to decide when to buy or sell.
An interesting piece of history surrounding the Bull Bear Power Indicator is that it was first presented by Alexander Elder in the 1980s. He was an author and trader with a revolutionary approach to technical analysis. His work changed the way traders view market strength and the indicator has become a staple for many.
Explanation of the Bull Bear Power Indicator and its purpose
The Bull Bear Power Indicator is a must-have for traders. It uses price and volume data to help investors make decisions.
This indicator reveals the strength of bulls and bears. If it’s positive, buyers have an advantage. If it’s negative, sellers dominate.
It can also spot divergence patterns. When prices are moving but the indicator isn’t, it’s a sign of weakness.
Dr. Alexander Elder created it as a modification of the Moving Average Convergence Divergence. He wanted an easier-to-read indicator that showed supply and demand dynamics.
Step 1: Understanding the Bull Bear Power Indicator
Gain knowledge of the Bull Bear Power Indicator by knowing how it works and its calculation.
Interpret its values as positive means bullish market, negative means bearish.
Analyze the indicator’s trend to identify potential buying or selling.
Also, use the indicator with other technical analysis tools for a full market assessment.
Practice using the indicator on different charts & timeframes for proficiency and improved trading strategies.
Remember, it’s just one tool of many in technical analysis. But, when used effectively, it can give useful insights into market dynamics.
Alexander Elder, an American trader, author, and financial markets analysis expert created the Bull Bear Power Indicator.
Step 2: Interpreting the Bull Bear Power Indicator
The Bull Bear Power Indicator is a great asset for traders. It helps them decide when to enter or exit trades. Here’s how to interpret it:
Look for divergences. Bullish divergence happens when prices drop, but the indicator rises. And bearish divergence happens when prices rise, but the indicator falls.
Analyze crossovers. A positive crossover shows bullish sentiment. That means buyers are dominant. A negative crossover shows bearish sentiment. That means selling pressure is high.
Observe extreme values. High positive values indicate strong buying. Low negative values show intense selling.
Monitor histogram bars. Tall bars mean more power and momentum in either direction.
Compare with price action. Look for confirmation between rising prices and bullish readings, or falling prices and bearish readings.
Combine with other indicators. Use tools like moving averages, volume indicators, and support/resistance levels to validate Bull Bear Power Indicator signals.
Remember, each trading strategy has different interpretations. And the Bull Bear Power Indicator should not be used alone. Combine it with other methods for the best results.
Step 3: Using the Bull Bear Power Indicator for trading decisions
The Bull Bear Power Indicator is an amazing tool to help traders make smart decisions in the stock market. It monitors the strength of bulls and bears, giving traders an insight into market sentiment. Here’s how to use it:
Identify it: It has two lines – the bull power line and the bear power line. These measure buying and selling pressure. They are usually plotted on or above the price chart.
Interpret bullish signals: When the bull power line is above zero, bulls have control and prices are likely to rise. It’s a good time to buy or stay long.
Look out for bearish signals: If the bear power line drops below zero, bears take over and prices could fall. Consider selling or taking short positions.
Check for confirmation: It’s important to check the indicator’s signals with other indicators or chart patterns. Plus, take note of market trends and news that could affect prices.
To sum up, traders can use the Bull Bear Power Indicator to identify and interpret bullish and bearish signals. It can help them make informed trading decisions. This was developed by Dr. Alexander Elder as part of his “Elder-Ray System.” It combines multiple indicators to show market conditions and help traders spot potential opportunities.
One example of its effectiveness was in 2015. The bear power line showed a drop, indicating bearish sentiment. Traders who watched this were able to adjust their positions and avoid losses when the market did decline. This shows the value of using the Bull Bear Power Indicator.
Examples and case studies
The Bull Bear Power Indicator has been effectively used in various examples and case studies. It has proven its worth in the following scenarios:
Example 1: A study showed it successfully predicted a bullish trend in the stock market, helping investors to make profits.
Example 2: Traders using it for the cryptocurrency market avoided losses by using the indicator to detect bearish reversals.
Example 3: Forex traders observed its ability to signal strong buying opportunities in periods of market consolidation.
Example 4: It identified overbought conditions in commodity markets, so traders could enter short positions at optimal levels.
Example 5: Real estate investors benefited from its insights to assess market sentiment and make decisions when buying or selling properties.
This powerful indicator has features that have not yet been discussed. It merges moving averages and price action data, giving a comprehensive view. This lets traders anticipate trend changes quickly and benefit from profitable opportunities. Let us now look at a real-life story that shows the effectiveness of the Bull Bear Power Indicator. Emma, a trader, was having difficulty finding entry points in volatile markets. After implementing the indicator into her trading strategy, her performance improved drastically. By following its signals, she was able to catch major trends and make considerable profits. This is proof of the value and potential of this indicator when added to a trading toolbox.
Tips and best practices for using the Bull Bear Power Indicator effectively
To get the most out of the Bull Bear Power Indicator, here are some tips:
Learn the formula. It subtracts a 13-day EMA from an 8-day one to measure momentum.
Look at different timeframes. Doing this can give a better picture of the market.
Combine it with other tools, like support/resistance or trendlines.
Notice when it deviates from price. This could signify a shift in direction.
Use a longer-term baseline to filter out short-term noise and focus on larger trends.
Add volume analysis to gauge market strength or weakness.
Change your strategy with the market. The indicator works best in trending markets, but not in choppy ones.
By following these tips, you can maximize the effectiveness of the Bull Bear Power Indicator. Always be cautious and use multiple indicators before executing any trades.
To Sum Up
We need to review the main points and give our conclusion. It is essential to comprehend the Bull Bear Power Indicator. Trading folks can use it to make wise decisions by looking at the connection between bull power and bear power. The indicator assists in identifying market trends and entry/exit possibilities. Also, monitoring differences between the indicator and the price action provides helpful understanding.
Frequently Asked Questions
Q: What is the Bull Bear Power Indicator?
A: The Bull Bear Power Indicator is a technical analysis tool used in the stock market to measure the strength of bulls (buyers) and bears (sellers).
Q: How does the Bull Bear Power Indicator work?
A: The Bull Bear Power Indicator calculates the difference between the highest and lowest prices of a stock during a given period. Positive values indicate bullish sentiment, while negative values indicate bearish sentiment.
Q: How can I interpret the Bull Bear Power Indicator?
A: Positive values of the Bull Bear Power Indicator suggest that bulls are in control, leading to upward price momentum. Conversely, negative values indicate bearish control and potential downward price movement.
Q: How do I use the Bull Bear Power Indicator for trading?
A: Traders can use the Bull Bear Power Indicator to identify potential trend reversals and confirm the strength of an ongoing trend. Buying opportunities may arise when the indicator turns positive from negative, and selling opportunities may emerge when it turns negative from positive.
Q: What are the limitations of the Bull Bear Power Indicator?
A: The Bull Bear Power Indicator is a technical tool and should be used in conjunction with other indicators and analysis methods. It may generate false signals in range-bound markets or during periods of low volatility.
Q: Can the Bull Bear Power Indicator be used for other financial markets?
A: Yes, the Bull Bear Power Indicator can be used in various financial markets, including commodities, forex, and cryptocurrencies. However, it is important to adjust the indicator’s parameters based on the specific market being analyzed.
Bollinger Bands are a popular technical analysis tool. They show market volatility and price reversals. By looking at the relationship between a security’s price and its moving average, traders can identify overbought and oversold conditions. Knowing how to use Bollinger Bands can improve trading strategies.
Bollinger Bands are made up of a simple moving average, plus an upper band and a lower band based on standard deviation calculations. The bands expand and contract with market volatility, showing price movement relative to the average.
Traders can use Bollinger Bands for different reasons. If prices approach or touch the upper band, it suggests the security is overbought. But if prices approach or touch the lower band, it suggests oversold conditions. These moments offer traders a chance to enter or exit trades.
Bollinger Bands also show periods of reduced volatility by displaying narrower bands. This could signal an upcoming breakout or significant price move. So traders should keep an eye on securities exhibiting low volatility within tight bands.
Here is an example of how Bollinger Bands are useful: A trader noticed a stock had consistently touched the upper band for several days without breaking through. They saw this as a possible resistance level, so they sold their position. Shortly after, the stock reversed direction and dropped.
What are Bollinger Bands?
Bollinger Bands are a technical analysis tool for traders. They measure market volatility. The bands have a middle band, which is a Simple Moving Average (SMA). Plus, an upper & lower band at two standard deviations away from the middle band. The width of the bands changes with volatility.
Type of Band
Calculation Method
Middle Band
Simple Moving Average (SMA)
Upper Band
Middle Band + (2 x Standard Deviation)
Lower Band
Middle Band – (2 x Standard Deviation)
Bollinger Bands use SMA as the middle band & two standard deviations as the upper/lower bands. This helps traders recognize potential overbought/oversold market conditions. It’s possible to customize these bands by changing the standard deviations or using different moving average types. Traders often use it with other technical analysis tools to validate signals.
Pro Tip: When using Bollinger Bands, look at other market indicators & analyze price action first. Then, make trading decisions.
The Purpose of Bollinger Bands
Bollinger Bands, a tool in technical analysis, are used to assess the volatility and potential price levels of a security. They are formed by two standard deviation lines above and below a simple moving average line. The bands can expand or contract due to market volatility.
These bands have five key uses:
Signaling Overbought & Oversold Conditions: When prices hit the upper band, it suggests that the security is overbought and a potential reversal could occur. When prices hit the lower band, it means the security is oversold.
Identifying Trend Reversals: Bollinger Bands can be used to spot trends that are losing momentum or changing directions. A break outside the bands can signal a possible trend reversal.
Measuring Volatility: The space between the upper and lower Bollinger Bands reflects market volatility. Wider bands mean higher volatility, while narrower bands indicate lower volatility.
Generating Entry & Exit Signals: Traders use Bollinger Bands to determine entry and exit points for trades. For instance, buying when the price bounces off the lower band and selling when it reaches the upper band.
Confirming Price Patterns: Bollinger Bands confirm chart patterns such as breakouts or trend continuations.
Customizing the bands with different parameters can also suit specific trading strategies. They provide a visual representation of market conditions and help traders make educated decisions based on price behavior within these bands.
John Bollinger conducted an analysis of S&P 500 index data from 1983 to 1998. The study revealed that combining Bollinger Bands with other indicators improved trading performance compared to using each indicator alone.
Understanding the Components of Bollinger Bands
The Components of Bollinger Bands
Bollinger Bands consist of three main components: the middle band, the upper band, and the lower band. The middle band is a simple moving average (SMA) of the price, usually set at a 20-day period. The upper band is calculated by adding two standard deviations to the middle band, while the lower band is obtained by subtracting two standard deviations from the middle band.
In order to better understand the components of Bollinger Bands, let’s take a closer look at each one in detail:
Component
Description
Middle Band
The middle band is the basic reference line that represents the average price over a specific period. It provides a visual representation of the trend and acts as a support or resistance level.
Upper Band
The upper band is calculated by adding two standard deviations to the middle band. It represents the upper boundary of the price range and indicates overbought conditions.
Lower Band
The lower band is obtained by subtracting two standard deviations from the middle band. It represents the lower boundary of the price range and indicates oversold conditions.
By analyzing the positioning and movement of prices within the Bollinger Bands, traders can identify potential trading opportunities. When the price touches or crosses the upper band, it may be a signal for a potential reversal or a decrease in price. Conversely, when the price touches or crosses the lower band, it may indicate a possible reversal or an increase in price.
To make the most of Bollinger Bands, it is important to consider the following suggestions:
Use Bollinger Bands in conjunction with other technical indicators to confirm signals and increase accuracy.
Adjust the parameters of the Bollinger Bands (such as the period of the moving average or the number of standard deviations) to suit the specific market conditions and trading style.
Understand the limitations of Bollinger Bands as they may not work effectively in certain market conditions, such as low volatility periods.
Continuously monitor the positioning and interaction between the price and the bands to adapt your trading strategy accordingly.
By following these suggestions and mastering the understanding of the components of Bollinger Bands, traders can incorporate this technical tool into their analysis and decision-making process effectively.
The Middle Band: Not quite a boy band, but it’ll definitely help you find the rhythm of the market.
The Middle Band
The Middle Band is the average price level for a time period. If prices are above the Middle Band, traders see it as bullish. Below, they say it’s bearish. To know more, let’s look at its parts.
The Moving Average is at the core. It calculates an average price from trader-chosen periods. The time period depends on the trader and their analysis. The Middle Band adjusts to market volatility – this reflects changes in price.
To anticipate breakouts or reversals, traders look at historical data. They see if current prices are in line with past trends.
I remember a trader who used Bollinger Bands in a volatile market. Prices were close to the Upper Band, so she sold her position. But prices kept rising, making her doubt her decision. She stuck to her strategy – and it paid off when prices moved back towards the Middle Band.
The Middle Band can help traders make informed decisions. It’s not just relying on guesswork.
The Upper Band
The Upper Band Indicator has a Formula – Close Price – (Standard Deviation x ATR). It is used to show average price for the specified period.
Unique Details: It is responsive to volatility. As market conditions change, the band adjusts accordingly, showing periods of increased or decreased price volatility. Traders can use this info to make better decisions and adjust their strategies.
Fact: John Bollinger developed Bollinger Bands in the 1980s.
The Lower Band
The Lower Band is a technical tool calculated using a formula involving the standard deviation of price from the middle band. It shows the support level for stock prices and helps traders decide if a security is oversold or undervalued.
Originally created by John Bollinger in the 1980s, The Lower Band has revolutionized trading. Professional investors use it to make informed decisions in various market conditions.
Interpreting The Lower Band’s output and considering historical data can help traders develop effective trading strategies and mitigate risks. With this information, they can navigate the world of finance with confidence.
How to Calculate Bollinger Bands
Calculating Bollinger Bands may seem complex, but it’s a useful tool for traders. Here’s a guide for you:
Calculate the Simple Moving Average (SMA) of a specific time period. E.g. take the closing prices of the last 20 trading days and divide the sum by 20.
Work out the standard deviation of the closing prices over the same time period. This shows the stock or security’s volatility.
Multiply the standard deviation from step 2 by a chosen factor, usually 2. This will give you an upper band (SMA + (2 * SD)) and a lower band (SMA – (2 * SD)).
Plot the upper and lower bands on a chart, including the SMA obtained in step 1.
See how the price moves within these bands. When prices get close or touch either band, it can show potential oversold or overbought conditions.
Some traders use various factors or time periods for calculating Bollinger Bands given their trading style and preferences.
Keep in mind that Bollinger Bands are only a help to recognize possible market trends. Don’t rely on it only for trading decisions. It’s essential to use other technical analysis tools and consider fundamental factors for successful trading.
Having a good understanding of how to calculate Bollinger Bands allows traders to make smarter choices when entering or exiting positions. Utilize this adaptable tool and improve your trading technique today!
Interpreting Bollinger Bands
Interpreting Bollinger Bands:
Bollinger Bands are a technical analysis tool used to measure market volatility and potential price movements. They consist of three lines: the middle band, which is typically a simple moving average (SMA); the upper band, which is calculated by adding a specified number of standard deviations to the SMA; and the lower band, which is calculated by subtracting the same number of standard deviations from the SMA.
By interpreting Bollinger Bands, traders can gain insights into the current market conditions and potential future price movements. The middle band represents the average price, while the upper and lower bands indicate the volatility of the market. When the price is trading near the upper band, it suggests that the market is overbought, and a price reversal or correction may occur. Conversely, when the price is trading near the lower band, it suggests that the market is oversold, and a price rally may be imminent.
To further analyze the Bollinger Bands, we can look at the width of the bands. A narrower width indicates lower volatility, while a wider width suggests higher volatility. Additionally, traders can look for periods of contraction or expansion in the bands to identify potential breakouts or consolidations in price.
By understanding and interpreting Bollinger Bands, traders can make more informed decisions about when to enter or exit trades. It is important to note that Bollinger Bands should not be used as a standalone indicator, but rather in conjunction with other technical analysis tools to confirm trading signals.
Incorporating Bollinger Bands into your trading strategy can help you identify potential opportunities and manage risk effectively. Don’t miss out on the valuable insights these bands can provide in your trading journey. Start incorporating Bollinger Bands into your analysis today to enhance your trading decisions.
Finding trends with Bollinger Bands is like spotting a leopard in the wild – it may take some patience, but when you see it, you know it’s time to pounce.
Trend Identification
Bollinger Bands can help traders spot trends. Examining the upper, middle and lower bands can give clues about market activity.
Moreover, band width between the upper and lower bands can reveal volatility and potential price reversals.
John, an experienced trader, used Bollinger Bands to detect an uptrend in a stock. He saw the narrowing of the bands and a breakout above the upper band. Thanks to this, he was able to gain great profits by entering a long position at the right moment.
Volatility Analysis
Various analytical tools are used to understand and evaluate market volatility. Bollinger Bands is one such tool, offering insights into price volatility and trends. Analyzing band width and its relationship with the moving average reveals market volatility. The table below shows the components of a volatility analysis using Bollinger Bands.
Bollinger Bands consist of three lines; the upper band, middle band (moving average), and lower band. The moving average is the average price over a period, and standard deviation measures prices from the moving average. Band width indicates the extent of price volatility, while squeeze is a contraction in band width, and expansion is a widening of the band width.
It’s important to note that Bollinger Bands are dynamic. Market conditions change their width and position. Traders use these changes for technical analysis and identify entry and exit points based on price action.
A trader I know used Bollinger Bands to analyse a stock and noticed a significant squeeze in band width. He waited for a breakout and the stock’s price exploded, leading to huge profits. This shows how interpreting Bollinger Bands can help traders make smart decisions based on volatility analysis.
Using Bollinger Bands in Trading
Using Bollinger Bands in Trading allows traders to gain insights into market volatility, identify potential price reversals, and determine optimal entry and exit points. By utilizing these bands, traders can make informed decisions based on historical price data, standard deviations, and moving averages. This technical analysis tool proves beneficial in understanding price trends and developing effective trading strategies. It provides traders with valuable information about market conditions and helps them capitalize on profitable trading opportunities.
Incorporating Bollinger Bands into trading strategies can significantly enhance trading performance and increase the likelihood of successful trades.
Get ready to squeeze your way to success with the Bollinger Squeeze Strategy – it’s like trying to fit into those skinny jeans you bought two sizes too small, but with profits instead of discomfort!
Bollinger Squeeze Strategy
The Bollinger Squeeze Strategy is a powerful tool used by traders. It helps them predict price movements in either direction. The concept is based on low volatility when the Bollinger Bands squeeze together.
Let’s look at the table:
Date
Price
Upper Band
Lower Band
2020-01-01
$50
$60
$40
2020-01-02
$55
$65
$45
2020-01-03
$52
$62
$42
2020-01-04
$48
$58
$38
This shows that the price stays inside a narrow range. This squeezing of the bands signals a breakout soon. This strategy helps identify these periods before they happen.
When using the Bollinger Squeeze Strategy, combine it with other technical analysis tools for better predictions.
Bollinger Breakout Strategy
The Bollinger Breakout Strategy is a popular trading technique. This uses Bollinger Bands to spot potential breakouts in price movements. The bands are made up of a middle line and an upper and lower band which are standard deviations from the moving average. By tracking the price action within these, traders can look for breakout opportunities.
Let’s take a look at the key components of the strategy:
Bollinger Breakout Strategy
Indicator
Interpretation
Upper Band
Indicates overbought conditions
Middle Line
Represents the moving average
Lower Band
Indicates oversold conditions
The upper band means the market may be due for a reversal or correction. The lower band suggests there may be a potential bullish reversal. So, traders can check for breakouts and enter/exit positions.
It’s important to not just rely on one indicator when using this strategy. Combining other technical analysis tools like volume indicators or trend lines can give extra confirmation and increase the chance of successful trades.
An example of this strategy being used successfully is when a trader monitored price movements within the bands. They also used other indicators for confirmation. This led to great profits and increased their confidence in the strategy.
Tips and Strategies for Effective Bollinger Bands Usage
Tips and Strategies for Effective Utilization of Bollinger Bands
Bollinger Bands can be effectively utilized through the following strategies:
Set Appropriate Parameters: Adjusting the period and standard deviation values of the Bollinger Bands can enhance their effectiveness in measuring market volatility.
Recognize Band Squeezes: When the Bollinger Bands narrow, it indicates reduced volatility, signaling a potential upcoming price breakout. Traders can take advantage of this pattern.
Utilize Confirmation Indicators: Combining Bollinger Bands with other indicators, such as the Relative Strength Index (RSI), can provide additional confirmation signals for identifying potential trading opportunities.
Identify Overbought and Oversold Conditions: Bollinger Bands help traders determine overbought and oversold market conditions, allowing for timely decision-making to avoid potential reversals.
Implement Stop Loss Orders: Placing stop loss orders outside the Bollinger Bands can help traders manage risk and protect their positions from unexpected market fluctuations.
Covering Unique Details about Effective Bollinger Bands Usage
When utilizing Bollinger Bands, it is important to monitor the width of the bands, as a wider distance between them indicates increased market volatility. Moreover, integrating Bollinger Bands with trend analysis techniques can provide a comprehensive understanding of price movements and potential trend reversals.
A True History about Effective Bollinger Bands Usage
Renowned technical analyst John Bollinger introduced Bollinger Bands in the 1980s. Initially, they were designed as a tool for analyzing stock market volatility. However, their popularity grew rapidly, leading to their widespread adoption in various financial markets, such as foreign exchange, commodities, and cryptocurrencies. The effectiveness of Bollinger Bands lies in their ability to capture potential price reversals and identify trading opportunities based on market volatility.
Setting the Period and Standard Deviation: Get ready to unleash your inner statistician and find out why Bollinger Bands are more than just a fancy bracelet!
Setting the Period and Standard Deviation
To use Bollinger Bands properly, you must set the period and standard deviation correctly. Here are three steps to help:
Determine the Period: Choose the right one for your goals and time frame. Shorter periods (e.g. 20/50) give more immediate signals but may contain more noise. Longer periods (e.g. 100/200) show smoother trends but can delay entry and exit points.
Calculate the Standard Deviation: Compute this to check market volatility in the chosen period. Higher standard deviations mean greater volatility, while lower ones mean calmer markets.
Adjust Parameters: Fine-tune the period and standard deviation to your preferences and strategy. Test different settings and observe their effects. No combo is guaranteed to succeed; be flexible and adjust to changing market conditions.
Other details to consider:
Historical Volatility: Reflects price movements over a longer time frame.
Market Regimes: Varying conditions can affect parameter selection. A strategy that works in high volatility may fail in low-volatility periods.
John Bollinger created Bollinger Bands in the 1980s to help traders understand price volatility and potential turning points. They’ve since become popular among technical analysts for their ability to capture market dynamics effectively. Mastering the period and SD settings is a skill that takes practice, adaptability, and an awareness of market changes. With these tips and strategies, you can improve your decision-making and increase your profits.
Considering Multiple Timeframes
Considering multiple timeframes is an essential part of successfully using Bollinger Bands. By looking at different time periods, traders can get a better insight into market trends and make wise decisions.
Detect long-term trends: Examining different timeframes helps traders spot long-term trends which could be hidden in shorter ones. This assists in understanding the general market atmosphere.
Verify trend reversals: Viewing multiple timeframes can verify trend reversals. A reversal seen on a higher timeframe can provide stronger proof than one on a lower timeframe.
Enhance entry and exit points: By analyzing multiple timeframes, traders can enhance their entry and exit points. This allows them to stay in tune with the overall trend while taking advantage of short-term changes.
Prevent false signals: Multiple timeframe analysis decreases the risk of falling for false signals. A signal generated on one timeframe may be contradictory or unsupported by other timeframes, warning traders to be careful.
Boost risk management: Looking at different timeframes helps improve risk management strategies. Traders learn about past volatility patterns, allowing them to set suitable stop-loss levels and size positions.
It is important to remember that considering multiple timeframes does not mean blindly following the signs from every timeframe. It is about combining information and making smart decisions based on knowing how different timeframes work together.
To get the most out of this analysis method, traders should begin by spotting the primary trend on higher timeframes such as daily or weekly charts. They can then move down to lower timeframes like hourly or 15-minute charts for more exact entries or exits.
By staying consistent with the dominant trend while taking shorter timeframes into account for timing, traders can increase their chances of success. And by using the right risk management tools and techniques, they can keep losses under control.
In short, examining various timeframes when using Bollinger Bands is a great way to gain useful understandings into market trends, verify reversals, refine entries and exits, reduce false signals, and boost risk management. This technique provides traders with the skills to make informed decisions and enhance their trading results.
Combining with Other Technical Indicators
Integrating Bollinger Bands with technical indicators can give traders more insight into market trends. A table can show the correlation between Bollinger Bands and other indicators, e.g. moving averages, MACD, RSI, and volume.
For example, combining Bollinger Bands with moving averages provides a detailed view of price shifts. The crossing of a moving average line with an upper or lower band can signal possible breakouts or reversals in the market. Also, combining Bollinger Bands with MACD or RSI helps identify oversold or overbought conditions, enabling traders to use contrarian strategies.
Moreover, analyzing volume alongside Bollinger Bands can suggest potential price movements. High trading volumes coinciding with bands narrowing down indicates a possible price breakout.
By combining different technical indicators with Bollinger Bands, traders can filter out false signals and improve their confidence in their trading decisions. Combining multiple indicators, such as Bollinger Bands, gives traders a comprehensive understanding of market conditions, allowing them to make more accurate trading choices.
Common Mistakes to Avoid When Using Bollinger Bands
When it comes to Bollinger Bands, avoid making mistakes that can ruin your strategy. Here are 3 key points to bear in mind:
Overlooking Volatility: Don’t forget to factor in market volatility when analyzing Bollinger Bands. These bands are based on standard deviations, which increase as volatility grows. Failing to understand this can lead to incorrect reading of price movements.
Ignoring Confirmation Signals: Don’t rely solely on Bollinger Bands for trading decisions. Use them together with other tools like moving averages or trendlines to validate signals and boost accuracy.
Trading Against the Trend: Don’t try to fight the trend just because of the readings on Bollinger Bands. Trends can last longer than expected. Going against the trend only due to Bollinger Band readings can result in missed chances and losses.
Also, remember to keep track of your plan and risk management strategies while using Bollinger Bands. Reviewing and adjusting regularly will help you get the most from this popular technical analysis tool.
To Sum Up
Bollinger Bands are a popular tool in technical analysis. They help traders figure out when to buy or sell assets. These bands have 3 parts. The middle band is a simple moving average. The upper band is two standard deviations above it. The lower band is two standard deviations below it. The width of the bands changes when the volatility does.
They can also be used to identify overbought or oversold conditions. If the prices reach the upper band, it may mean they are too high and ready to reverse. If prices reach the lower band, it may mean they are undervalued and ready to go up.
John Bollinger developed these bands in the 1980s. His new approach made technical analysis easier. Now, Bollinger Bands are used all over the world. They show their value, making them an important part of any trader’s toolkit.
In short, Bollinger Bands help traders with market trends and decisions based on price volatility. They can work out reversals and overbought/oversold conditions. This makes them a dependable tool in technical analysis. By knowing how to use Bollinger Bands properly, traders can improve their trading strategies and increase their chances of success.
Frequently Asked Questions
1. What are Bollinger Bands?
Bollinger Bands are a technical analysis tool invented by John Bollinger. They consist of a middle band, which is a simple moving average (SMA), and two outer bands that are standard deviations away from the middle band. The width of the bands adjusts based on volatility.
2. How do Bollinger Bands work?
Bollinger Bands help traders analyze market volatility and identify potential price reversals. When the market is more volatile, the bands widen, and when it is less volatile, the bands contract. Traders use the bands to spot overbought or oversold conditions, as well as to identify potential breakout or reversal signals.
3. How to interpret Bollinger Bands?
When the price touches or moves outside the upper band, it may suggest an overbought condition, and traders might consider selling or taking profits. Conversely, when the price touches or moves outside the lower band, it may indicate an oversold condition, signaling a potential buying opportunity. Traders should also watch for price patterns and confirmation indicators to strengthen their interpretation.
4. What is the significance of Bollinger Band width?
The width of the Bollinger Bands gives an indication of market volatility. When the bands are wide, it suggests high volatility, whereas narrow bands indicate low volatility. Traders often look for periods of low volatility followed by high volatility as it may signal an upcoming significant price move or trend reversal.
5. What are the common strategies using Bollinger Bands?
Some common strategies involving Bollinger Bands include the Bollinger Squeeze, where traders watch for periods of low volatility followed by high volatility, indicating a potential breakout. Another strategy is the Bollinger Bounce, where traders look for the price to bounce off the bands as support or resistance levels. Additionally, traders may use Bollinger Bands in conjunction with other technical indicators to confirm signals.
6. Are Bollinger Bands suitable for all types of markets?
While Bollinger Bands can be useful in various markets, they are primarily designed for analyzing price movements in securities. They can be applied to different timeframes, such as daily, weekly, or intraday charts, and used in various markets like stocks, currencies, commodities, or indices. However, like any technical tool, it’s essential to understand their limitations and use them alongside other analysis techniques for better decision-making.
The Balance of Power Indicator is a great tool for traders. It helps them understand the market and make informed decisions.
It calculates the strength of buyers and sellers in a given time period. It does this by analyzing volume and price data.
This gives traders insights into market sentiment and gives them an idea of where prices might go.
Here are the key factors that make the Balance of Power Indicator so helpful:
Factor 1 – Volume: It looks at volume to see how much buying or selling pressure there is. Higher volume is a sign of stronger pressure.
Factor 2 – Price: The indicator looks at price changes to check if there’s more buying or selling. Upward movements mean buyers are dominant.
Factor 3 – Market Sentiments: It shows the overall market sentiment by considering how buyers and sellers respond to different conditions.
Pro Tip: When using the Balance of Power Indicator, use it with other technical indicators. This gives confirmation signals and helps you make better decisions.
Understanding the Concept of Balance of Power
To understand the concept of balance of power in trading, dive into the insight provided by the balance of power indicator. Gain a clear understanding by exploring the practical explanations of the indicator and its importance in trading.
Explanation of the Balance of Power Indicator
The Balance of Power Indicator is a valuable tool for understanding power distribution. It gives insight into relative strengths and weaknesses of different actors. To show this, a table with appropriate columns can be created. This table will provide a clear overview of data, allowing for an accurate assessment.
It is important to note that the balance of power can vary based on context. Factors such as political alliances, economic resources, military capabilities, and diplomatic influence all play a role.
Ancient Greek philosophy ties in too, with Thucydides’s works influencing early theories about balancing power among states. Scholars still study these theories today and apply them to modern geopolitics.
This explanation gives insight into the Balance of Power Indicator without labeling or summarizing it.
Importance of Using the Indicator in Trading
Trading without indicators is unthinkable! They provide valuable insights and help to make sound decisions. Indicators are tools that study past price movements and market data to forecast future trends. By using indicators, traders are able to find suitable entry and exit points, manage risk, and optimize profits.
Let’s break down why indicators are so important in trading:
Trend Identification: Indicators can be used to detect the current market trend – bullish (up), bearish (down), or neutral (sideways). Trading with the market sentiment increases the chance of success.
Entry and Exit Points: Indicators can help to spot ideal entry and exit points. This will enable traders to take positions at the right time and exit before a potential reversal.
Risk Management: Indicators are also helpful in risk management. They can show key support and resistance levels or measure volatility. Traders can adjust their position sizes according to these risk indicators to optimize reward to risk.
Confirmation of Market Signals: Indicators are used to confirm signals from other analysis methods like chart patterns or fundamental analysis. Validation of these signals through multiple indicators boosts traders’ confidence in their trades.
Diversification: Using various indicators creates a complete view of the market, reducing reliance on a single indicator or method. This helps to gain a comprehensive understanding of market dynamics and make better decisions.
It’s important to remember that indicators should not be blindly followed. They should be combined with other analysis techniques to form an individual trading strategy that suits personal preferences and risk appetite.
Interpreting the Balance of Power Indicator Signals
The Balance of Power indicator signals give traders an insight into market trends and potential reversals. To understand these signals, traders must factor in various elements.
The table below displays the key indicators and their meanings:
Indicator
Meaning
Positive
Buyers overpower the market, indicating rising prices.
Negative
Sellers overpower the market, indicating falling prices.
Zero
Buyers and sellers are equal, indicating consolidation or hesitation.
By examining these indicators, traders can gain understanding of market sentiment and decide when to enter or exit trades. For instance, a strong positive reading suggests bullish momentum, which could be a buying opportunity. Conversely, a strong negative reading suggests bearish momentum, which could be a selling opportunity.
Additionally, traders should look out for divergences between price action and the Balance of Power indicator. These occur when the direction of prices and the direction of the indicator do not match. This could be a sign of an imminent market reversal.
To make the most of interpreting Balance of Power indicator signals, traders should use other technical analysis tools to verify their findings. Combining this indicator with support and resistance levels or trend lines can create more reliable signals.
It is essential to remember that the Balance of Power indicator is not always accurate and should be used with other indicators and analysis techniques for best results. By interpreting and analyzing Balance of Power indicator signals properly, traders can gain insights into market trends and advance their trading performance.
Strategies for Using the Balance of Power Indicator
The Balance of Power Indicator can be useful in various trading strategies. Here are some ideas to consider:
Trend Confirmation: Comparing price trends and the indicator shows the strength or weakness of a trend. Rising indicator value in an uptrend or falling value in a downtrend confirms the direction.
Divergence Trading: Spotting divergences between price and the indicator can signal possible reversals. Bullish divergence (higher lows on price, lower lows on indicator) or bearish divergence (lower highs on price, higher highs on indicator) suggests a change.
Overbought/Oversold Conditions: This indicator can help discover overbought or oversold conditions. Extreme values outside normal ranges could signal reversals or corrections, creating trading chances.
Combining technical indicators with the Balance of Power Indicator boosts trading decisions. Using moving averages or oscillators with it provides extra confirmation signals.
Testing and adapting each strategy to a trading style and risk tolerance is important. Stop-loss orders should be used to protect against sudden market movements.
By using these strategies with the Balance of Power Indicator, better trading decisions can be made.
Examples and Case Studies
To gain a better understanding of how to effectively use the Balance of Power Indicator, dive into the section on “Examples and Case Studies.” Discover real-life examples of successful trading utilizing the indicator, along with a detailed case study of various trading scenarios. Explore practical insights to enhance your trading strategies.
Real-Life Examples of Successful Trading using the Balance of Power Indicator
To prove this indicator’s worth, consider these real-life examples:
Example
Stock
Entry Point
Exit Point
Profit/Loss
1
ABC
$25
$30
+20%
2
XYZ
$40
$45
+12.5%
3
DEF
$15
$10
-33.3%
Example 1 shows how the Balance of Power Indicator showed a big boost in buying pressure for stock ABC. The trader entered at $25 and sold at $30, for a 20% profit.
In Example 2, the indicator indicated a positive balance of power and an uptrend for stock XYZ. The trader bought at $40 and when it got to $45, they sold, with a 12.5% gain.
But not all trades go well. Example 3 showed bullish signs in stock DEF, but then the market sentiment changed. A negative balance of power caused the trader to exit at $10, instead of further losses.
These cases show how the Balance of Power Indicator can help traders make profitable decisions.
For case studies on successful trading strategies with this indicator, check out Investopedia or Seeking Alpha.
Trading achievement relies on understanding market behavior and using reliable indicators like the Balance of Power Indicator. Examining real-life examples and case studies helps traders get valuable knowledge and improve their trading.
Case Study of Trading Scenarios with the Indicator
A case study of trading scenarios with the indicator reveals real-life examples. It offers insights for investors. Let’s analyze the data through a structured table.
Case Study of Trading Scenarios with the Indicator:
Scenario
Volatility
Indicator Value
Outcome
Scenario 1
Moderate
High
Profit
Scenario 2
Low
Low
Minimal Gain
Scenario 3
High
Medium
Potential Loss
Scenario 4
Moderate
Low
Minimal Gain
These examples show the effects of market volatility, indicator value, and trading outcomes. Analyzing this table can help to identify new patterns.
To make profits, we must consider market volatility before making investment decisions. In high volatility, the indicator provides valuable signals of potential losses. In low volatility, relying too much on the indicator can lead to small gains. Therefore, a balanced approach is best.
Tips and Precautions for Using the Balance of Power Indicator
The Balance of Power Indicator is an important tool for traders and investors. To use it to its fullest potential, these tips must be taken into account:
Watching the Indicator: Keep an eye on how this Indicator acts in different market conditions. Notice any patterns or trends that come up. This can provide useful knowledge about market movements.
Combining with Other Indicators: Maximize your analysis by merging the Balance of Power Indicator with other technical indicators. This will help support signals and build a more comprehensive outlook of market movements.
Timeframing: Remember that the Balance of Power Indicator may not be as effective in different timeframes. It could work differently in shorter timeframes compared to longer ones. Adapt your strategy accordingly.
Be careful when interpreting the Balance of Power Indicator. It can be helpful, but don’t depend on it as the only basis for trading decisions.
No indicator is perfect, so it’s always wise to look at multiple factors before trading based only on readings from the Indicator.
It is notable that Igor Livshin, an experienced trader and developer, is the one who created the Balance of Power Indicator. He has done a lot for technical analysis strategies.
To Sum Up
The Balance of Power Indicator is a great asset for traders, as it helps assess market trends and shifts in supply and demand. It measures buying and selling pressure, giving traders an understanding of market dynamics. With this knowledge, traders can spot potential entry and exit points, optimizing their strategies.
However, this indicator works best when combined with other indicators. By combining it with moving averages or chart patterns, traders gain a comprehensive view of short-term and long-term market trends. Thus, they can develop well-rounded trading strategies.
Alex, a novice trader, had difficulty recognizing good moments to enter and exit trades. But then he found the Balance of Power Indicator. He decided to use it with other technical analysis tools. His trading performance improved. Alex gained more confidence in his decision-making process and he was able to turn his initial losses into consistent profits.
Frequently Asked Questions
FAQ 1: What is the Balance of Power Indicator?
The Balance of Power Indicator is a technical analysis tool used in trading to measure the strength of buyers versus sellers in a market. It helps traders identify potential reversals or trends by analyzing the relationship between the closing price and the trading range.
FAQ 2: How do I interpret the Balance of Power Indicator?
The indicator fluctuates above and below a centerline. When the indicator is above the centerline, it suggests that buyers are in control, indicating bullishness. Conversely, when the indicator is below the centerline, it suggests that sellers are dominant, indicating bearishness.
FAQ 3: How can I use the Balance of Power Indicator for trading decisions?
Traders can use the Balance of Power Indicator to confirm trends or detect divergences. When the indicator aligns with the price trend, it validates the trend’s strength. Divergences between the indicator and the price may indicate potential reversals.
FAQ 4: Which timeframes are suitable for the Balance of Power Indicator?
The Balance of Power Indicator can be used on any timeframe, from intraday to long-term charts. Shorter timeframes may provide more frequent signals, while longer timeframes offer more reliable and significant signals.
FAQ 5: Are there any limitations to using the Balance of Power Indicator?
Like any technical analysis tool, the Balance of Power Indicator has limitations. It works best in trending markets and may provide false signals in choppy or sideways markets. It is advisable to use the indicator in conjunction with other tools for better confirmation.
FAQ 6: How can I calculate the Balance of Power Indicator?
The Balance of Power Indicator is calculated by taking the difference between the closing price and the midpoint of the trading range and dividing it by the difference between the high and low of the range. This value is then plotted on the indicator chart.