Twitter – No Deal on the Elon Musk Buy Out. How to Trade it Now?

TWTR after the announcement of no deal with Elon Musk

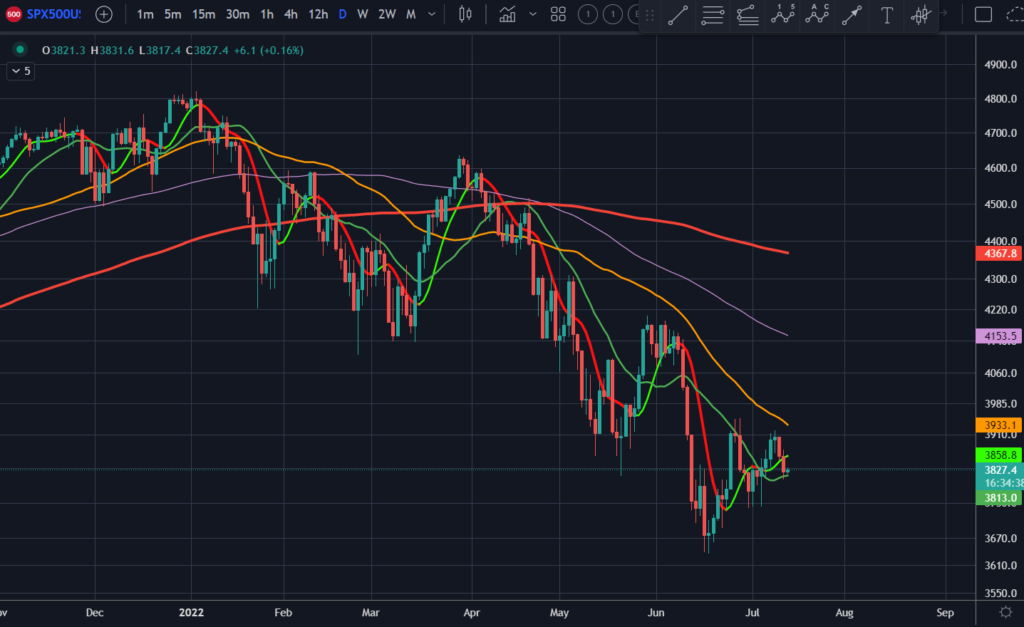
Twitter has seen a lot of news coverage for weeks now and there seems to be no end in sight.

The latest news is that Twitter is suing Musk for backing out of deal. How will it all play out in terms of price? Probability favors more downside action.

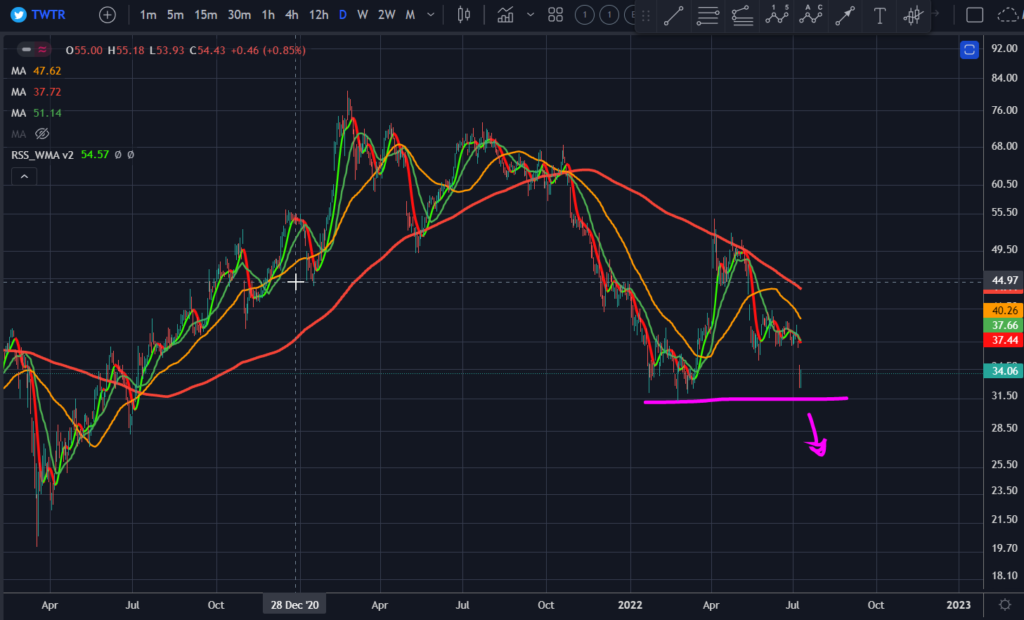
Look at the major support at 31.50 where it held the price 3 times prior to recently, making it the 4th time. Support and resistance don’t last forever and either we don’t come back here for awhile or it breaks. The more times we test it, the weaker the support becomes, like a glass bridge. When it does break, look out below.

Is Twitter stock going up?

How can one trade it? Watch for a break and go short or scale in short near the recent break at around 37.40. The price could definitely go into a recovery phase for the next month as well and depending on your trading time frame, you’ll have to adjust to that. Another big move either up or down in a few day’s time will more likely come when the overall market is in sell mode again.

This price zone is likely to cause another sequence of sideways action like before or not that strong uptrend. Twitter has been very news driven as well and these events can also cause price spikes in either direction.

When there are so many factors to consider, sometimes it’s just best to take it one day a time, keep it simple & Trade this Chart!

Click to rate this post!
[Total: 1 Average: 5]

Stock Market Sideways As Anticipated – What Happens Next?

S&P 500 Daily Chart

Ever since from our last update, the market indeed have been going sideways. There is clear resistance in the 3950 zone. While support has been rising and being tested. If we break below 3740, then we should continue the down trend.

Where is the Stock Market Going Next?

S&P 500 Weekly Chart

Our prediction is down. We still have 3 days before the weekly candle closes so anything can happen. If price remains at levels down here or below and the financial stocks are mostly selling off, then the general sell off should continue.

On the other hand, if the market ends up closing green for the week, then we can expect next week to finally break out of the consolidation zone so be patient and…

just keep it simple & Trade this Chart!

Click to rate this post!
[Total: 1 Average: 5]

Stock Market Gains – What Happens Next?

S&P 500 Daily Chart

End of week of 6/24/22, and we have ended the week with strong bullish action. This is a great sign for a multi-week run back to the upside. In our opinion, we’re looking for long opportunities cautiously as we are going against the intermediate trend.

Let’s look at the weekly chart below

S&P 500 Weekly Chart

What will the market do next week?

Our prediction is going to be an inside trading week or several weeks. In other words, a sideways market of consolidation. There is a lower chance of continued upward movement. If we do see strong buying early in the week, then follow through is more likely at the end of the week which will further indicate that the market has more legs to go up for another week.

One thing to keep in mind is that the summer doldrums are around the corner and we could see a drop in volume in trading. However, with all the economic news data around being bearish, we could see continued sell offs longer than expected so…

just keep it simple & Trade this Chart!

Click to rate this post!
[Total: 1 Average: 5]