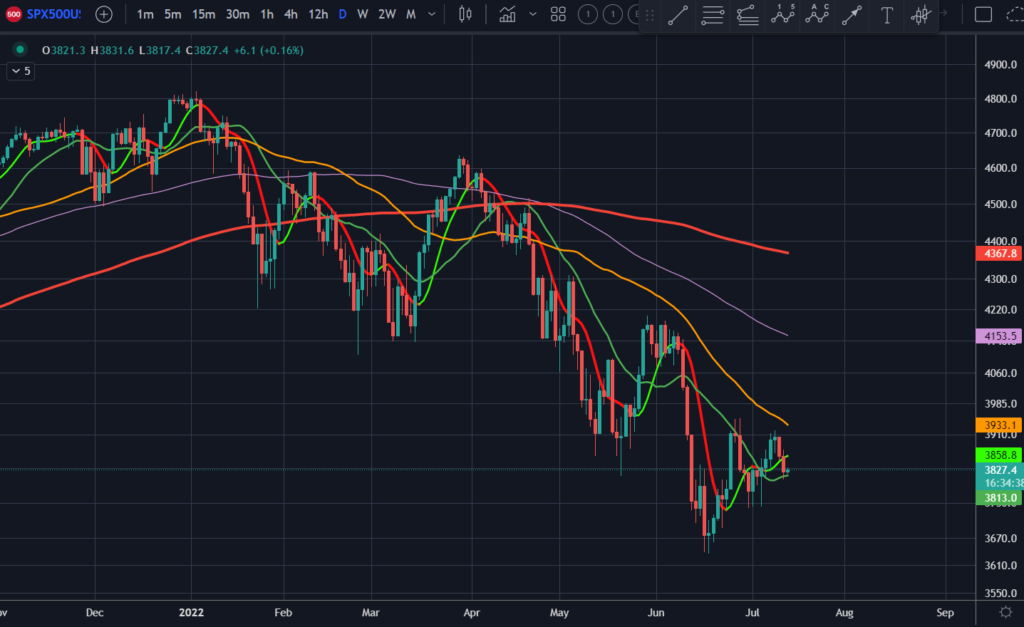
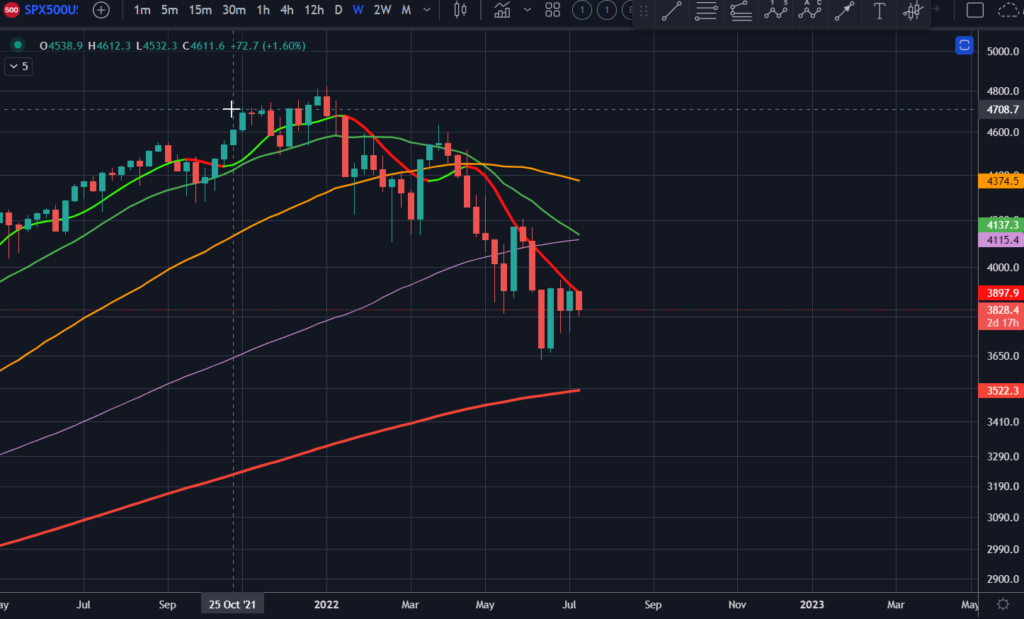
Ever since from our last update, the market indeed have been going sideways. There is clear resistance in the 3950 zone. While support has been rising and being tested. If we break below 3740, then we should continue the down trend.
Where is the Stock Market Going Next?
Our prediction is down. We still have 3 days before the weekly candle closes so anything can happen. If price remains at levels down here or below and the financial stocks are mostly selling off, then the general sell off should continue.
On the other hand, if the market ends up closing green for the week, then we can expect next week to finally break out of the consolidation zone so be patient and…
just keep it simple & Trade this Chart!
Click to rate this post!
[Total: 1 Average: 5]