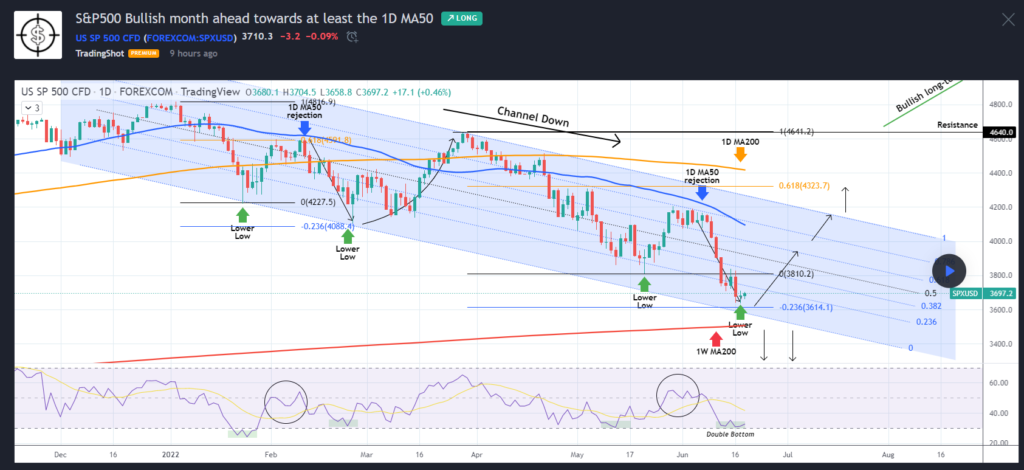
According to TradingShot from tradingview, we could be geared for a bullish few weeks and the monthly candle can close green.
Price has made a new Lower Low on the blue Channel above. The bottom of the channel is also aligned with the -0.236 Fibonacci extension. The expectation here is a bounce and price will move up for about 1 month.
Another clue that the authored pointed out is the daily RSI potential double bottom. This pattern mirrors the Lower Lows trade history of late January – February 2022, which resulted in a run up and created a channel down after the eventual sell off.
Our Take – Is the S&P 500 Going Back Up?
We think the S&P 500 will go up likely this or next week. There has been some bullish daily candles 5 trading days which indicates that there are buyers here.
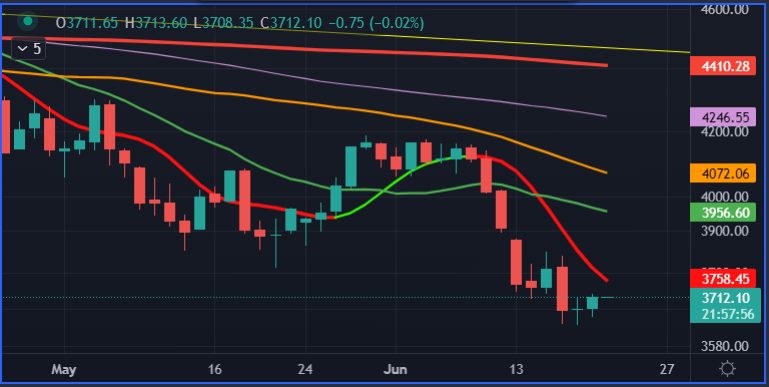
There is no question that the momentum is to the downside. All the moving averages are all pointed down. Any long positions will need to take caution and have a line drawn in the sand of where to exit if the trade goes against you.
What are some long side targets? 3900, 4100, 4400.